

Question: Keter to Table 56.1-Factors for Computing Control Chart Limits (3 sigma) for this problem. Thirty-five samples of size 7 each were taken from a
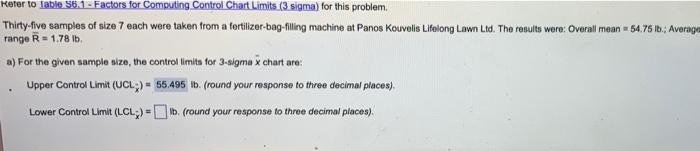
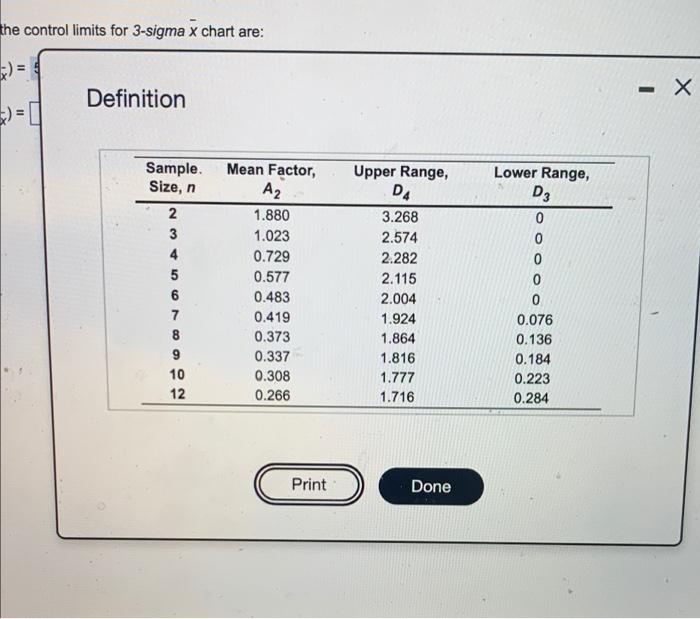
Keter to Table 56.1-Factors for Computing Control Chart Limits (3 sigma) for this problem. Thirty-five samples of size 7 each were taken from a fertilizer-bag-filling machine at Panos Kouvelis Lifelong Lawn Ltd. The results were: Overall mean = 54.75 lb.; Average range R = 1.78 lb. a) For the given sample size, the control limits for 3-sigma x chart are: Upper Control Limit (UCL) = 55.495 lb. (round your response to three decimal places). Lower Control Limit (LCL)=b. (round your response to three decimal places).
Step by Step Solution
There are 3 Steps involved in it
1 Expert Approved Answer
Step: 1 Unlock

Question Has Been Solved by an Expert!
Get step-by-step solutions from verified subject matter experts
Step: 2 Unlock
Step: 3 Unlock