

Question: Key comparative figures ($ millions) for both Apple and Google follow. Apple Key Figure Current Year Prior Year Liabilities + Equity $375,319 $321,686 Net income
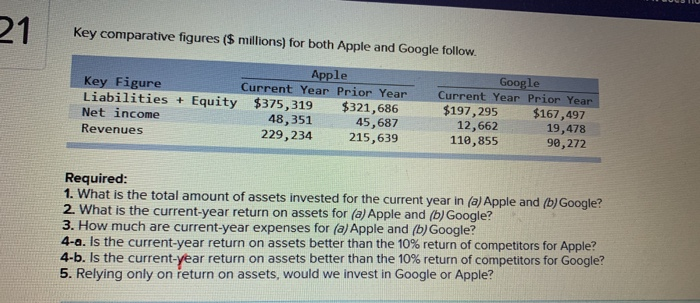
Key comparative figures ($ millions) for both Apple and Google follow. Apple Key Figure Current Year Prior Year Liabilities + Equity $375,319 $321,686 Net income 48,351 45,687 Revenues 229, 234 215,639 Google Current Year Prior Year $197,295 $167,497 12,662 19,478 110,855 90, 272 Required: 1. What is the total amount of assets invested for the current year in (a) Apple and (b) Google? 2. What is the current-year return on assets for (a) Apple and (b) Google? 3. How much are current-year expenses for (a) Apple and (b) Google? 4-a. Is the current-year return on assets better than the 10% return of competitors for Apple? 4.b. Is the current-year return on assets better than the 10% return of competitors for Google? 5. Relying only on return on assets, would we invest in Google or Apple
Step by Step Solution
There are 3 Steps involved in it

Get step-by-step solutions from verified subject matter experts