

Question: Key figures for Apple and Google follow Apple Google 5 millions Current Year Prior Year Total assets $338,516 $365,725 Current Year $275,909 Prior Year
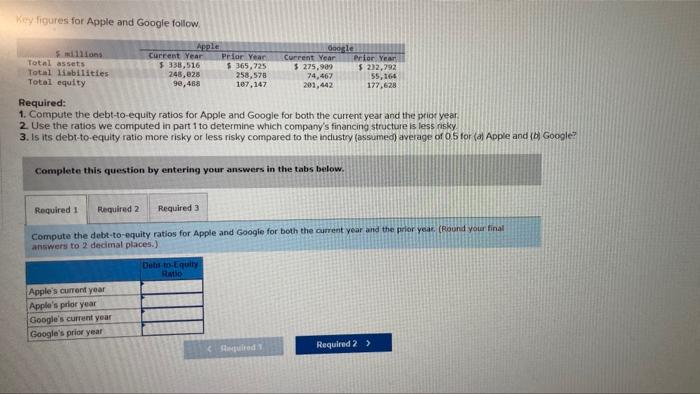
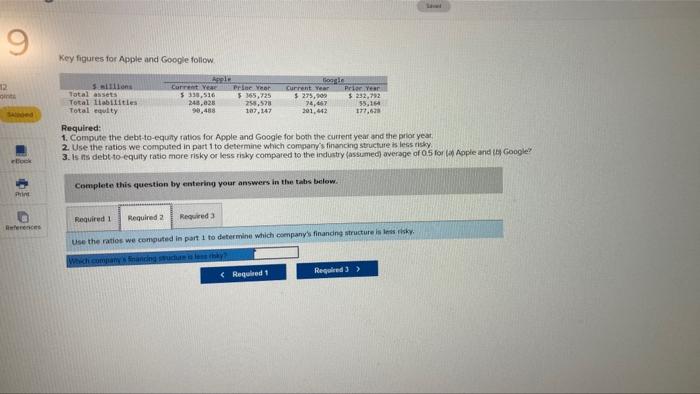
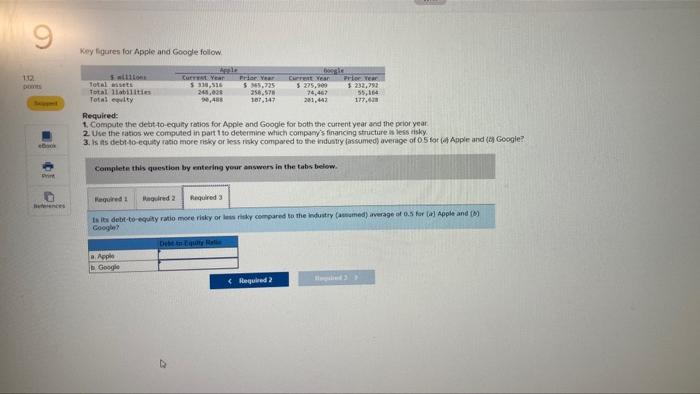
Key figures for Apple and Google follow Apple Google 5 millions Current Year Prior Year Total assets $338,516 $365,725 Current Year $275,909 Prior Year Total liabilities Total equity 248,028 90,488 258,578 74,467 107,147 201,442 $ 232,792 55,164 177,628 Required: 1. Compute the debt-to-equity ratios for Apple and Google for both the current year and the prior year. 2. Use the ratios we computed in part 1 to determine which company's financing structure is less risky 3. Is its debt-to-equity ratio more risky or less risky compared to the industry (assumed) average of 0.5 for (a) Apple and (b) Google? Complete this question by entering your answers in the tabs below. Required 1 Required 2 Required 3 Compute the debt-to-equity ratios for Apple and Google for both the current year and the prior year (Round your final answers to 2 decimal places.). Debs-to-Equity Ratio Apple's current year Apple's prior year Google's current year Google's prior year
Step by Step Solution
There are 3 Steps involved in it

Get step-by-step solutions from verified subject matter experts