

Question: Key figures for Apple and Google follow. $ millions Apple Google Current Year 1 Year Prior 2 Years Prior Current Year 1 Year Prior 2
Key figures for Apple and Google follow.
| $ millions | Apple | |||||
|---|---|---|---|---|---|---|
| Current Year | 1 Year Prior | 2 Years Prior | Current Year | 1 Year Prior | 2 Years Prior | |
| Operating cash flows | $ 69,391 | $ 77,434 | $ 64,225 | $ 54,520 | $ 47,971 | $ 37,091 |
| Total assets | 338,516 | 365,725 | 375,319 | 275,909 | 232,792 | 197,295 |
Required: 1. Compute the recent two years cash flow on total assets ratios for Apple and Google. 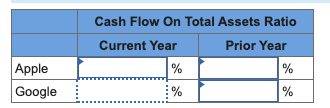
\begin{tabular}{|l|c|l|l|l|} \hline & \multicolumn{3}{|c|}{ Cash Flow On Total Assets Ratio } \\ \hline & \multicolumn{2}{|c|}{ Current Year } & \multicolumn{2}{c|}{ Prior Year } \\ \hline Apple & & & % \\ \hline Google & & .+... & & % \\ \hline \end{tabular}
Step by Step Solution
There are 3 Steps involved in it
1 Expert Approved Answer
Step: 1 Unlock

Question Has Been Solved by an Expert!
Get step-by-step solutions from verified subject matter experts
Step: 2 Unlock
Step: 3 Unlock