

Question: Key figures for Apple and Google follow. $ millio ns Apple Google Current Year Prior Year Current Year Prior Year Total assets $ 338,516 $
Key figures for Apple and Google follow. $ millio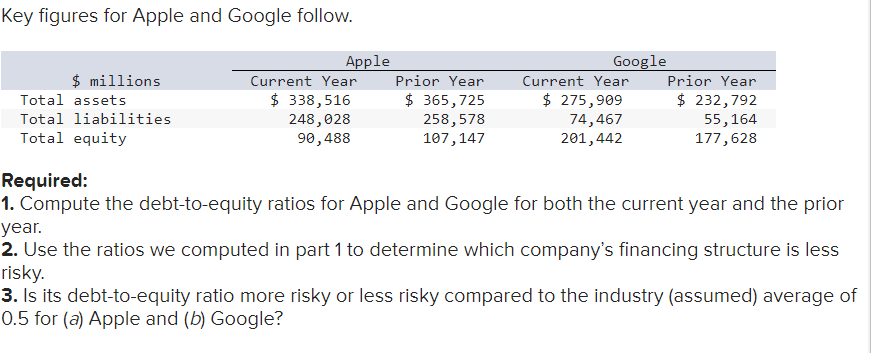 ns Apple Google Current Year Prior Year Current Year Prior Year Total assets $ 338,516 $ 365,725 $ 275,909 $ 232,792 Total liabilities 248,028 258,578 74,467 55,164 Total equity 90,488 107,147 201,442 177,628 Required: 1. Compute the debt-to-equity ratios for Apple and Google for both the current year and the prior year. 2. Use the ratios we computed in part 1 to determine which companys financing structure is less risky. 3. Is its debt-to-equity ratio m
Key figures for Apple and Google follow. Required: 1. Compute the debt-to-equity ratios for Apple and Google for both the current year and the prior year. 2. Use the ratios we computed in part 1 to determine which company's financing structure is less risky. 3. Is its debt-to-equity ratio more risky or less risky compared to the industry (assumed) average of 0.5 for (a) Apple and (b) Google
Step by Step Solution
There are 3 Steps involved in it

Get step-by-step solutions from verified subject matter experts