

Question: Key figures for Apple and Google follow. $ millions Total assets Apple Current Year 1 Year Prior 2 Years Prior Operating cash flows $
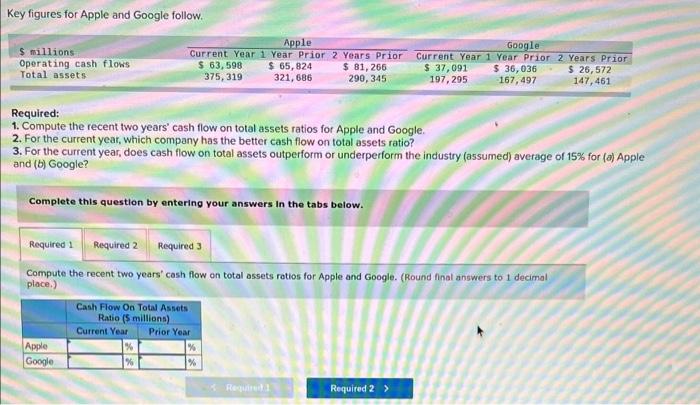
Key figures for Apple and Google follow. $ millions Total assets Apple Current Year 1 Year Prior 2 Years Prior Operating cash flows $ 63,598 375, 319 $ 65,824 321,686 $ 81,266 290, 345) Required: Google Current Year 1 Year Prior 2 Years Prior $ 37,091 197,295 $ 36,036 167,497 $ 26,572 147,461 1. Compute the recent two years' cash flow on total assets ratios for Apple and Google. 2. For the current year, which company has the better cash flow on total assets ratio? 3. For the current year, does cash flow on total assets outperform or underperform the industry (assumed) average of 15% for (a) Apple and (b) Google? Complete this question by entering your answers in the tabs below. Required 1 Required 2 Required 3 Compute the recent two years' cash flow on total assets ratios for Apple and Google. (Round final answers to 1 decimal place.) Cash Flow On Total Assets Ratio (5 millions) Current Year Apple Google % Prior Year % % Required 1 Required 2 > Required 1 Required 2 Required 3 For the current year, which company has the better cash flow on total assets ratio? Which company has the better cash flow on total assets ratio? Required 1 Required 2 Required 3 For the current year, does cash flow on total assets outperform or underperform the industry (assumed) average of 15% for (a) Apple and (b) Google? (a) Apple (b) Google
Step by Step Solution
There are 3 Steps involved in it

Get step-by-step solutions from verified subject matter experts