

Question: kindly help answer this question using the images provided. thank you. 1. does the density of a liquid depend on its volume? write your answer
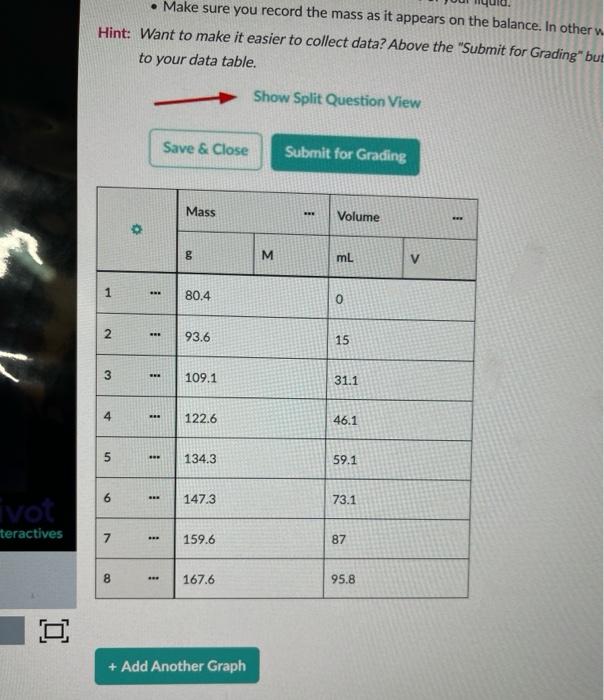
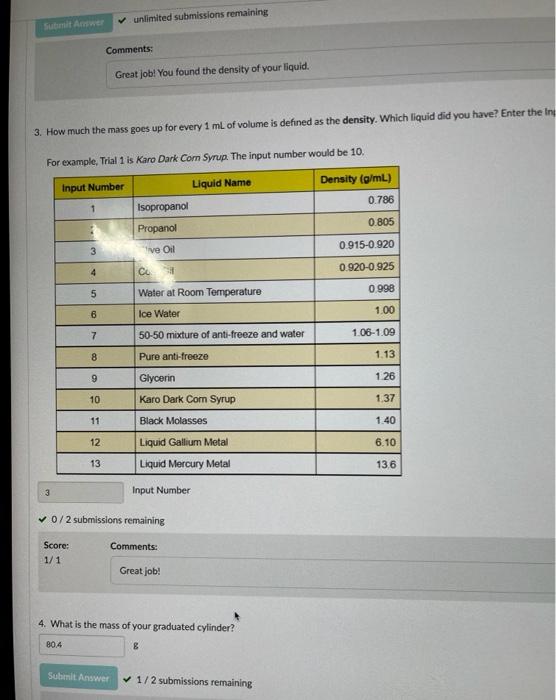
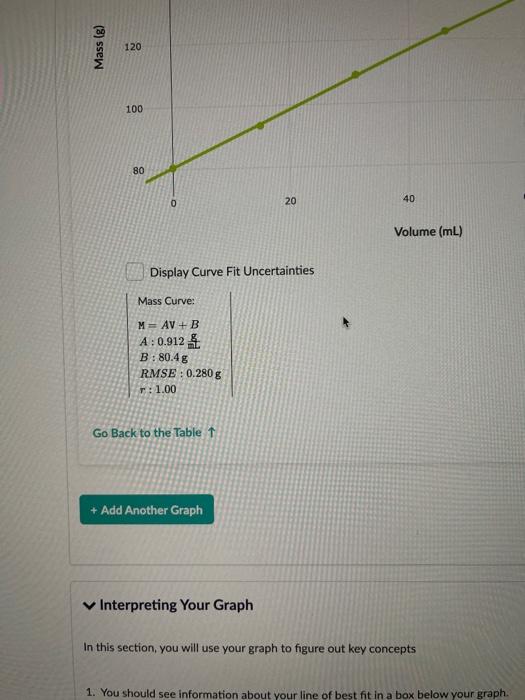
. Make sure you record the mass as it appears on the balance. In other Hint: Want to make it easier to collect data? Above the "Submit for Grading" but to your data table. - Show Split Question View Save & Close Submit for Grading Mass BRE Volume 00 M mL V 1 1 80.4 0 2 93.6 15 3 109.1 31.1 4 122.6 46.1 5 134.3 59.1 6 147.3 73.1 ivot teractives 7 ... 159.6 87 8 167.6 95.8 o + Add Another Graph unlimited submissions remaining Comments: Great job! You found the density of your liquid. 3. How much the mass goes up for every 1 mL of volume is defined as the density. Which liquid did you have? Enter the in For example, Trial 1 is Karo Dark Com Syrup. The input number would be 10. Input Number Liquid Name Density (g/mL) 0.786 1 Isopropanol 0.805 Propanol 0915-0.920 3 ve Oil 4 0.920-0.925 CU 5 Water at Room Temperature 0998 6 Ice Water 1.00 7 50-50 mixture of anti-freeze and water 1.06-1.09 8 Pure anti-freeze 1.13 9 Glycerin 1.26 10 Karo Dark Com Syrup 1.37 11 Black Molasses 1.40 12 Liquid Gallium Metal 6.10 13 Liquid Mercury Metal 136 3 Input Number 0/2 submissions remaining Comments: Score: 1/1 Great job! 4. What is the mass of your graduated cylinder? 80.4 8 Submit Answer 1/2 submissions remaining Mass (g) 120 100 80 0 20 40 Volume (mL) Display Curve Fit Uncertainties Mass Curve: M= AV + B A : 0.912 B: 80.4g RMSE: 0.280 g T: 1.00 Go Back to the Table 1 + Add Another Graph Interpreting Your Graph In this section, you will use your graph to figure out key concepts 1. You should see information about your line of best fit in a box below your graph
Step by Step Solution
There are 3 Steps involved in it

Get step-by-step solutions from verified subject matter experts