

Question: Kindly help me to plot that on graph as I don't know how to plot that on graph The following figure shows the market for
Kindly help me to plot that on graph as I don't know how to plot that on graph
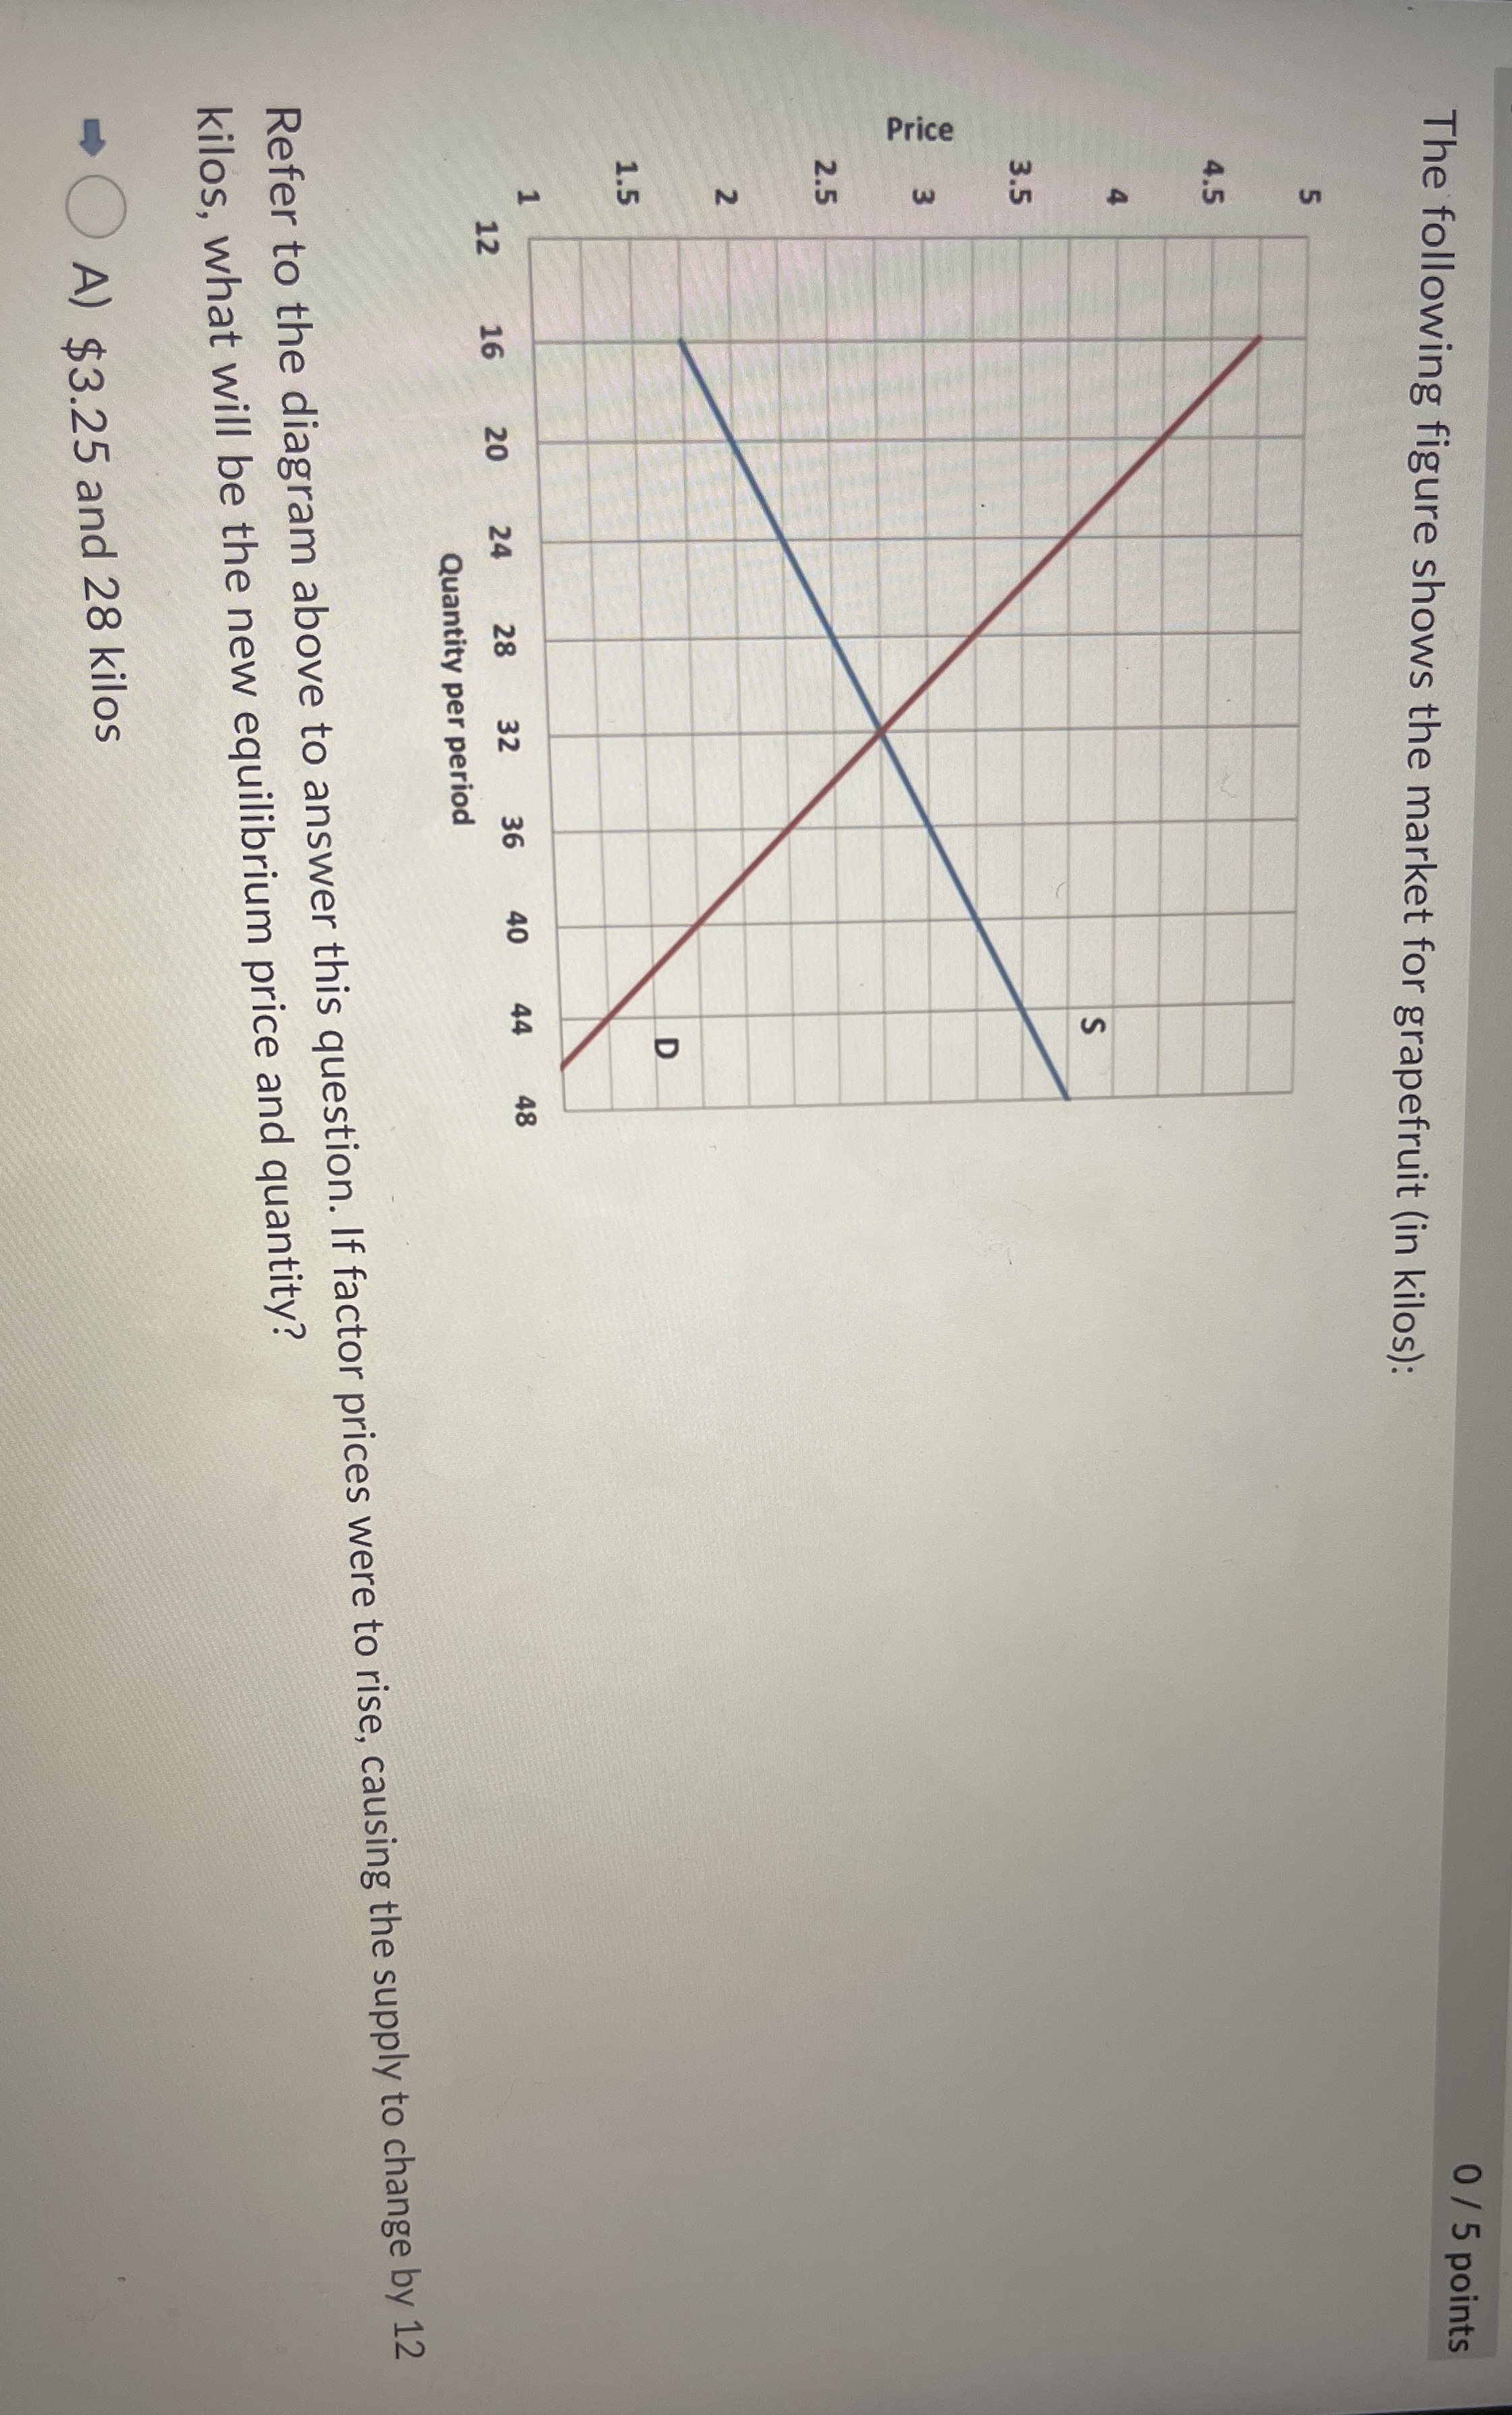
The following figure shows the market for grapefruit (in kilos): 0 / 5 points Price m N 20 24 28 32 44 Quantity per period Refer to the diagram above to answer this question. If factor prices were to rise, causing the supply to change by 12 kilos, what will be the new equilibrium price and quantity? - O A) $3.25 and 28 kilos
Step by Step Solution
There are 3 Steps involved in it
1 Expert Approved Answer
Step: 1 Unlock

Question Has Been Solved by an Expert!
Get step-by-step solutions from verified subject matter experts
Step: 2 Unlock
Step: 3 Unlock