

Question: @ Knowledge and Application: Two Variable Graphs and Statistics 1. Create scatter plots for Coffee vs. Year and Tea vs. Year and Coffee vs. Tea.
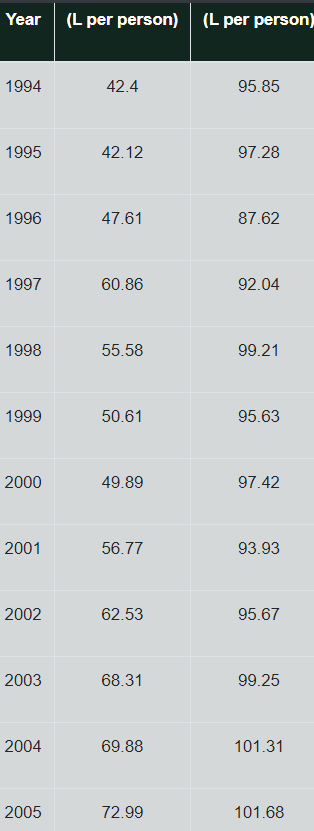
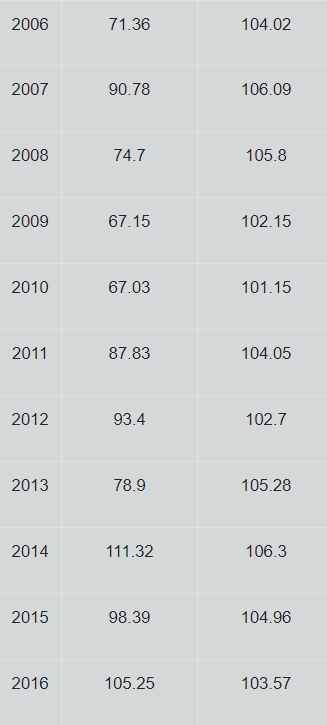
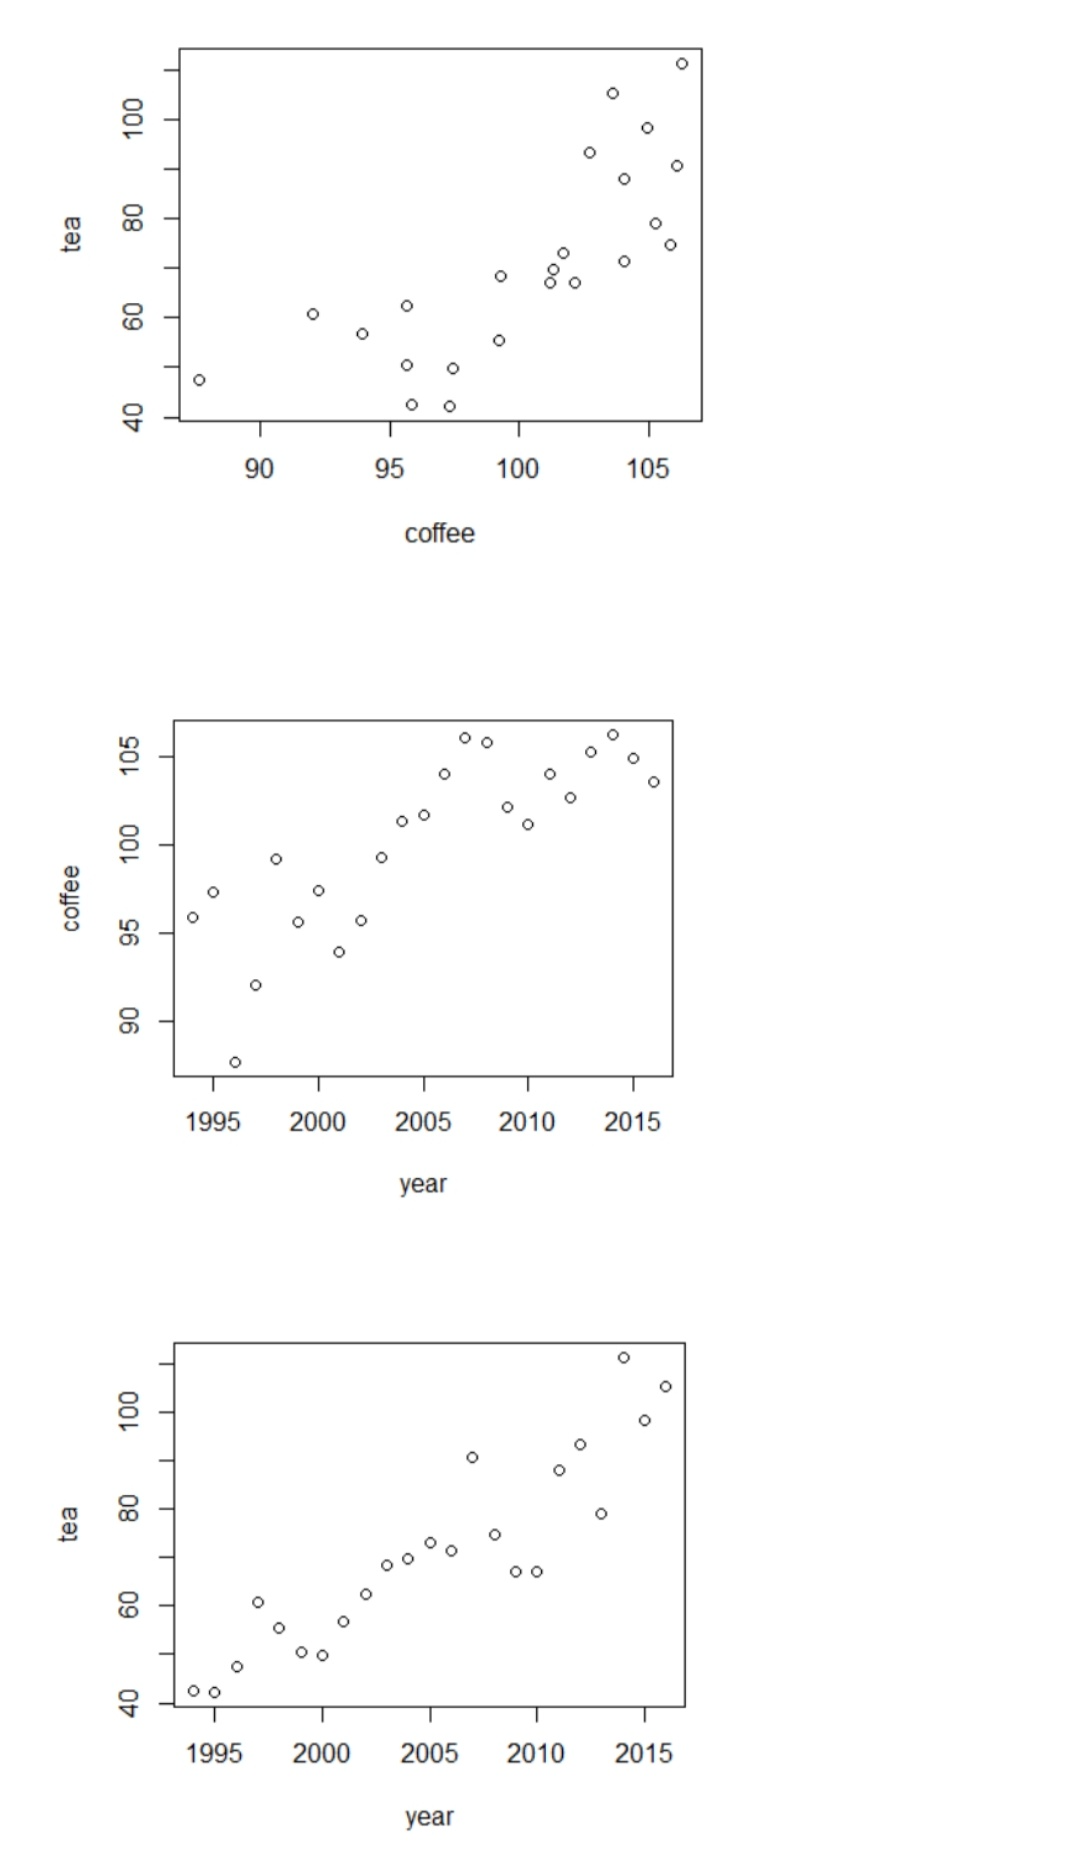
@ Knowledge and Application: Two Variable Graphs and Statistics 1. Create scatter plots for Coffee vs. Year and Tea vs. Year and Coffee vs. Tea. 2. Create and record the lines of best fit for each and the correlation coefficient. Go To YOU\" Pol'tfol o \f\f\f
Step by Step Solution
There are 3 Steps involved in it
1 Expert Approved Answer
Step: 1 Unlock

Question Has Been Solved by an Expert!
Get step-by-step solutions from verified subject matter experts
Step: 2 Unlock
Step: 3 Unlock