

Question: using this data Summative Cumulative Assighment Coffee Vs Tea Remember to copy and paste to Excel. Knowledge and Application: One Variable Graphs and Statistics 1.
using this data
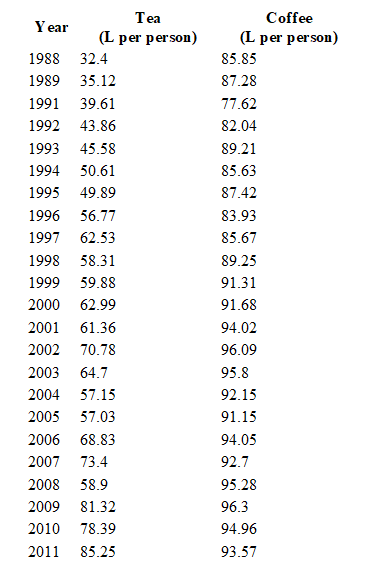
Summative Cumulative Assighment Coffee Vs Tea Remember to copy and paste to Excel. Knowledge and Application: One Variable Graphs and Statistics 1. Create a Histogram for both coffee and tea (total of 2 graphs). 2. Calculate the measures of Central Tendency (mean, median, mode) and spread (range, variance, standard deviation). 3. Create Box-Plots for both coffee and tea (total of 2 graphs) 4 Calculate the Interquartile Range (1GR) Tea Coffee Year (L per person) (L per person) 1988 32.4 85.85 1989 35.12 87.28 1991 39.61 77.62 1992 43.86 82.04 1993 45.58 89.21 1994 50.61 85.63 1995 49.89 87.42 1996 56.77 83.93 1997 62.53 85.67 1998 58.31 89.25 1999 59.88 91.31 2000 62.99 91.68 2001 61.36 94.02 2002 70.78 96.09 2003 64.7 95.8 2004 57.15 92.15 2005 57.03 91.15 2006 68.83 94.05 2007 73.4 92.7 2008 58.9 95.28 2009 81.32 96.3 2010 78.39 94.96 2011 85.25 93.57
Step by Step Solution
There are 3 Steps involved in it

Get step-by-step solutions from verified subject matter experts