

Question: KNOWLEDGE CHECK Here is a chart of the Nasdaq Composite, the world's main technology index. It peaked in the dotcom bubble on March 10, 2000.
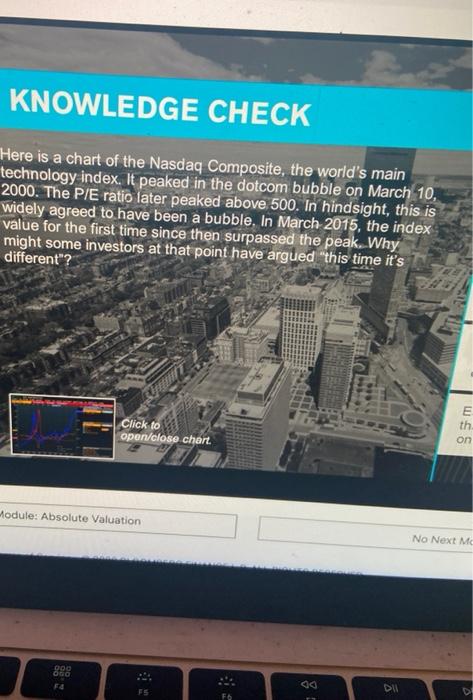
KNOWLEDGE CHECK Here is a chart of the Nasdaq Composite, the world's main technology index. It peaked in the dotcom bubble on March 10, 2000. The P/E ratio later peaked above 500. In hindsight, this is widely agreed to have been a bubble. In March 2015, the index value for the first time since then surpassed the peak. Why might some investors at that point have argued "this time it's different"? Click to open/close chart E th on Module: Absolute Valuation No Next MC 000 Oto DI Fb
Step by Step Solution
There are 3 Steps involved in it
1 Expert Approved Answer
Step: 1 Unlock

Question Has Been Solved by an Expert!
Get step-by-step solutions from verified subject matter experts
Step: 2 Unlock
Step: 3 Unlock