

Question: KNOWLEDGE CHECK What does Best 1 mean? Use the chart below to determine the definition. Highest standard deviation spread between Up and Down Best average
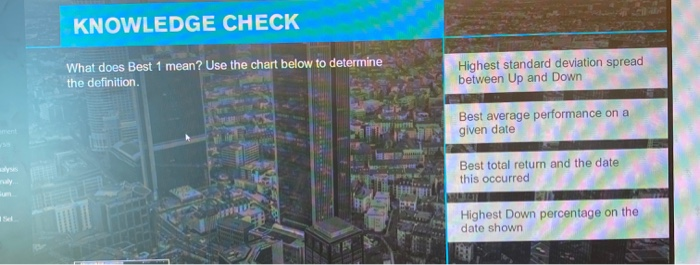
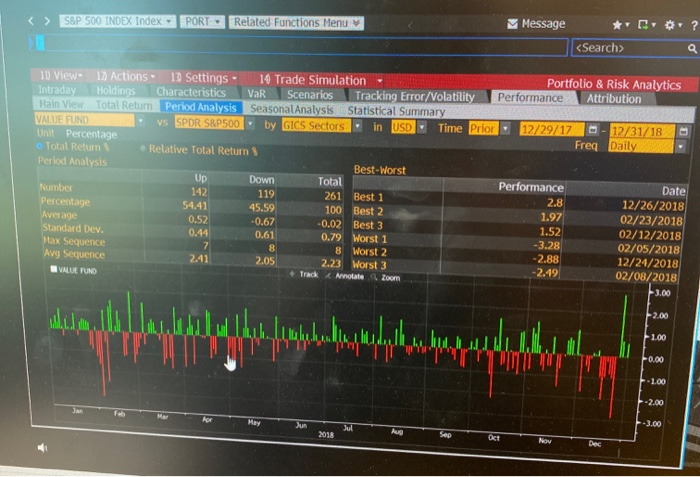
KNOWLEDGE CHECK What does Best 1 mean? Use the chart below to determine the definition. Highest standard deviation spread between Up and Down Best average performance on a given date alys Best total return and the date this occurred Highest Down percentage on the date shown S&P 500 INDEX Index - PORT - Related Functions Menu Message *
Step by Step Solution
There are 3 Steps involved in it

Get step-by-step solutions from verified subject matter experts