

Question: L 2. The data in the table below shows the average excess return of the U.S. equity market and the standard deviation of that excess
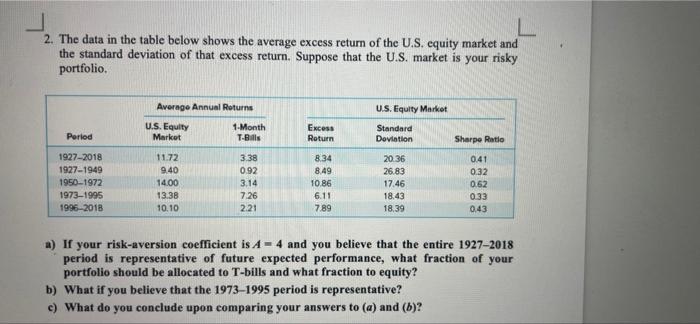
L 2. The data in the table below shows the average excess return of the U.S. equity market and the standard deviation of that excess return. Suppose that the U.S. market is your risky portfolio U.S. Equity Market Average Annual Returns U.S. Equity 1-Month Market T-Bills Excess Period Return Standard Dovlation Sharpe Ratio 1927-2018 1927-1949 1950-1972 1973-1995 1996-2018 11.72 9.40 14.00 13.38 10.10 3.38 0.92 3.14 7.26 834 8.49 10.86 6.11 7.89 20:36 26.83 17.46 18.43 18.39 0.41 0.32 0.62 033 0.43 2.21 a) If your risk-aversion coefficient is A = 4 and you believe that the entire 1927-2018 period is representative of future expected performance, what fraction of your portfolio should be allocated to T-bills and what fraction to equity? b) What if you believe that the 19731995 period is representative? c) What do you conclude upon comparing your answers to (a) and (b)
Step by Step Solution
There are 3 Steps involved in it

Get step-by-step solutions from verified subject matter experts