

Question: PLEASE USE EXCEL TO SOLVE THESE!!!! 3 ) The table above shows the average excess return of the U . S . equity market and
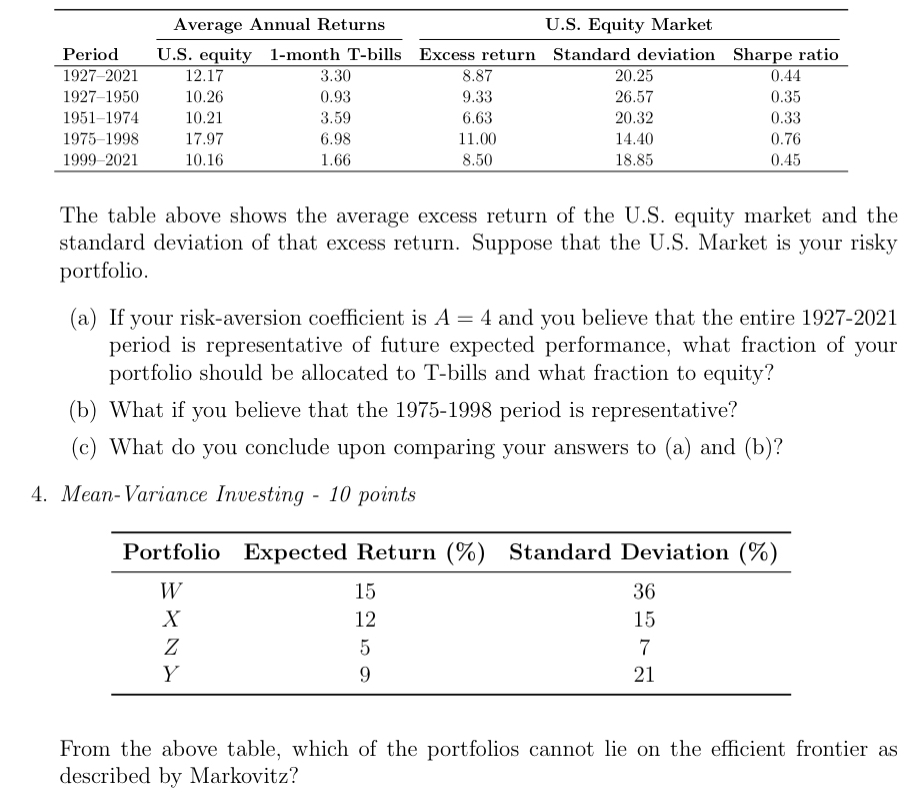
PLEASE USE EXCEL TO SOLVE THESE!!!! The table above shows the average excess return of the US equity market and the
standard deviation of that excess return. Suppose that the US Market is your risky
portfolio.
a If your riskaversion coefficient is and you believe that the entire
period is representative of future expected performance, what fraction of your
portfolio should be allocated to Tbills and what fraction to equity?
b What if you believe that the period is representative?
c What do you conclude upon comparing your answers to a and b
MeanVariance Investing points
From the above table, which of the portfolios cannot lie on the efficient frontier as
described by Markovitz?
Step by Step Solution
There are 3 Steps involved in it
1 Expert Approved Answer
Step: 1 Unlock

Question Has Been Solved by an Expert!
Get step-by-step solutions from verified subject matter experts
Step: 2 Unlock
Step: 3 Unlock