

Question: L M N BUSI 320 Comprehensive Problem 1 Spring 2020 Use the following information to answer the questions below: note: all sales are credit sales
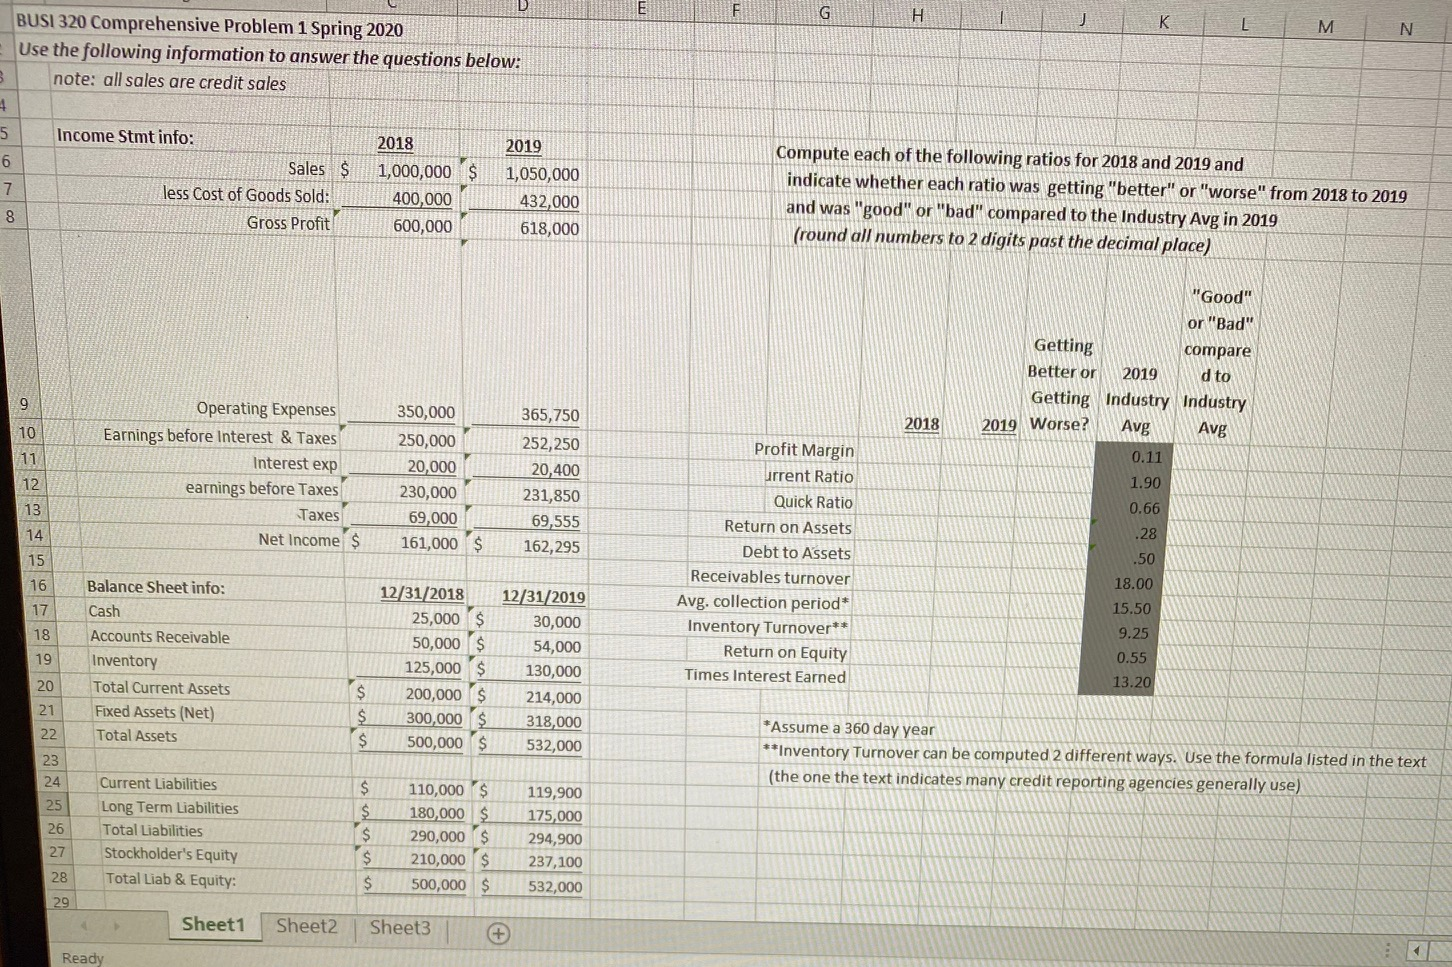
L M N BUSI 320 Comprehensive Problem 1 Spring 2020 Use the following information to answer the questions below: note: all sales are credit sales Income Stmt info: Sales $ less Cost of Goods Sold: Gross Profit 2018 1,000,000 $ 400,000 600,000 2019 1,050,000 432,000 618,000 Compute each of the following ratios for 2018 and 2019 and indicate whether each ratio was getting "better" or "worse" from 2018 to 2019 and was "good" or "bad" compared to the Industry Avg in 2019 (round all numbers to 2 digits past the decimal place) "Good" or "Bad" Getting compare Better or 2019 d to Getting Industry Industry 2019 Worse? Avg A Avg 0.11 1.90 0.66 .28 2018 Operating Expenses Earnings before Interest & Taxes Interest exp earnings before Taxes Taxes Net Income $ 350,000 250,000 20,000 230,000 69,000 161,000 365,750 252,250 20,400 231,850 69,555 162,295 $ .50 Profit Margin urrent Ratio Quick Ratio Return on Assets Debt to Assets Receivables turnover Avg. collection period* Inventory Turnover** Return on Equity Times Interest Earned 18.00 15.50 9.25 0.55 Balance Sheet info: Cash Accounts Receivable Inventory Total Current Assets Fixed Assets (Net) Total Assets 12/31/2018 25,000 $ 50,000 $ 125,000 $ 200,000 $ 300,000 $ 500,000 $ 12/31/2019 30,000 54,000 130,000 214,000 318,000 532,000 13.20 *Assume a 360 day year **Inventory Turnover can be computed 2 different ways. Use the formula listed in the text (the one the text indicates many credit reporting agencies generally use) $ 26 Current Liabilities Long Term Liabilities Total Liabilities Stockholder's Equity Total Liab & Equity: 110,000 $ 180,000 $ 290,000 $ 210,000 $ 500,000 $ 119,900 175,000 294,900 237,100 532,000 $ 29 Sheet1 Sheet2 Sheet3|
Step by Step Solution
There are 3 Steps involved in it

Get step-by-step solutions from verified subject matter experts