

Question: L Use the following data to answer the following question. Price Quantity Demanded Quantity Supplied Surplus $5 10 15 20 25 30 1,000 900
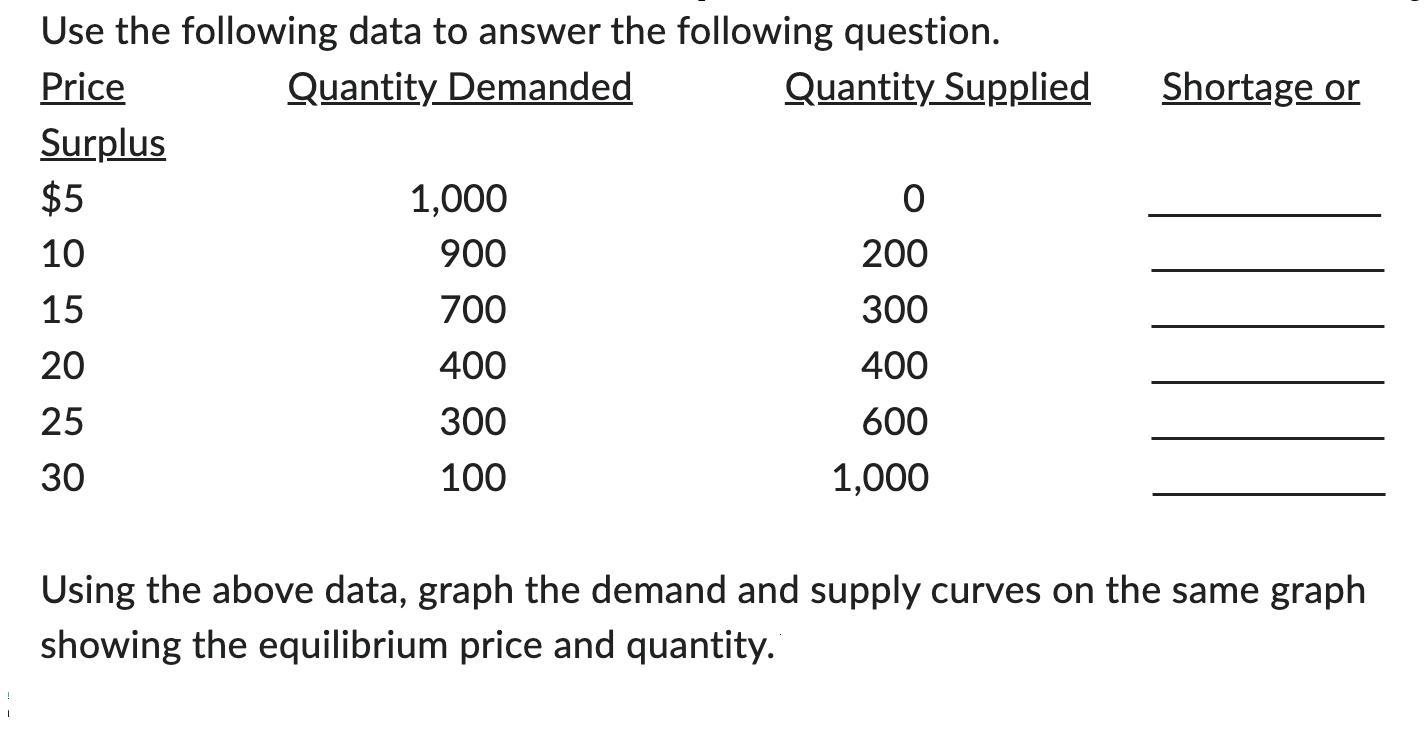
L Use the following data to answer the following question. Price Quantity Demanded Quantity Supplied Surplus $5 10 15 20 25 30 1,000 900 700 400 300 100 0 200 300 400 600 1,000 Shortage or Using the above data, graph the demand and supply curves on the same graph showing the equilibrium price and quantity.
Step by Step Solution
★★★★★
3.39 Rating (158 Votes )
There are 3 Steps involved in it
1 Expert Approved Answer
Step: 1 Unlock

price quantity demanded quantity supplied shortage or surplus 5 1000 0 Shortage 10 900 200 Shor... View full answer
Question Has Been Solved by an Expert!
Get step-by-step solutions from verified subject matter experts
Step: 2 Unlock
Step: 3 Unlock