

Question: la set is 1880 square feet Understanding summary statistics Homework . Unanswered In regards to the size of the houses in the data set, 75%
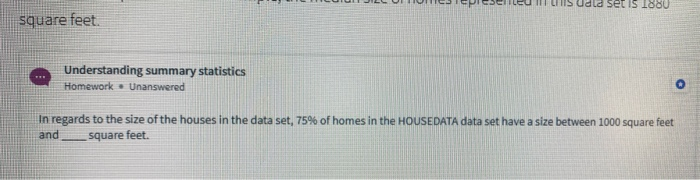
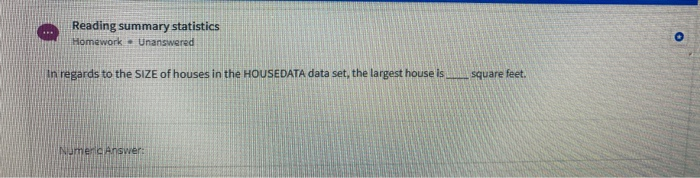
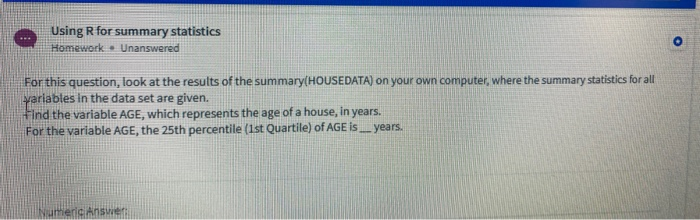
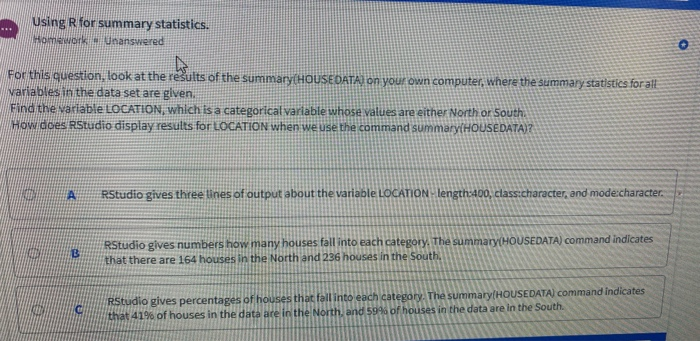
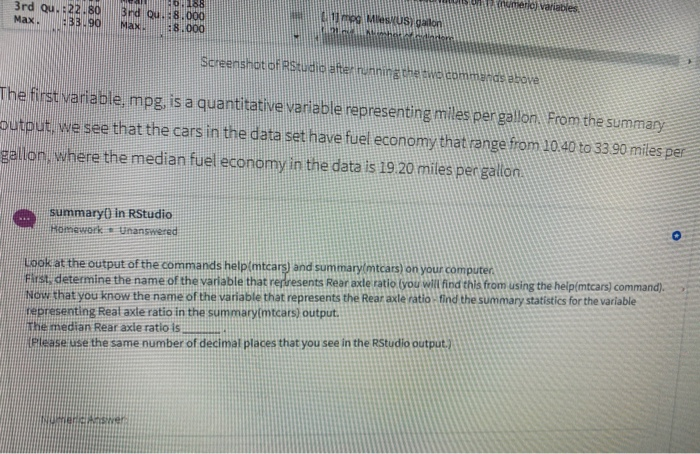
la set is 1880 square feet Understanding summary statistics Homework . Unanswered In regards to the size of the houses in the data set, 75% of homes in the HOUSEDATA data set have a size between 1000 square feet and square feet. Reading summary statistics Homework Unanswered o In regards to the SIZE of houses in the HOUSEDATA data set, the largest house is square feet Name Answers Using R for summary statistics Homework Unanswered For this question, look at the results of the summary(HOUSEDATA) on your own computer, where the summary statistics for all variables in the data set are given. find the variable AGE, which represents the age of a house, in years. For the variable AGE, the 25th percentile (1st Quartile) of AGE is years. Numeric Answer Using R for summary statistics. Homework.Unanswered For this question, look at the results of the summary(HOUSEDATA) on your own computer, where the summary statistics forall variables in the data set are given. Find the variable LOCATION, which is a categorical variable whose values are either North or South How does RStudio display results for LOCATION when we use the command summary(HOUSEDATA)? COM A RStudio gives three lines of output about the variable LOCATION - length:400, class:character, and mode:character. B RStudio gives numbers how many houses fall into each category. The summary(HOUSEDATA) command indicates that there are 164 houses in the North and 236 houses in the South, RStudio gives percentages of houses that fall into each category. The summary[HOUSEDATA) command indicates that 41% of houses in the data are in the North, and 594 of houses in the data are in the South OHL 1188 mumere Variables 3rd Qu.:22.80 Max. :33.90 3rd Qu.:8.000 Max 38.000 11 me Messgailon DAN ht Screenshot of Rstudio after turning the two commands above The first variable, mpg, is a quantitative variable representing miles per gallon. From the summary output, we see that the cars in the data set have fuel economy that range from 10.40 to 33 90 miles per gallon, where the median fuel economy in the data is 19 20 miles per gallon summary() in RStudio Homework Unanswered . Look at the output of the commands helpimtcars) and summary(mtcars) on your computer, First determine the name of the variable that represents Rear axle ratio Iyou will find this from using the help/mtcars) command). Now that you know the name of the variable that represents the rear axle ratio find the summary statistics for the variable representing Real axle ratio in the summarylmtcars) output. The median Rear axle ratio is Please use the same number of decimal places that you see in the RStudio output.) mensen la set is 1880 square feet Understanding summary statistics Homework . Unanswered In regards to the size of the houses in the data set, 75% of homes in the HOUSEDATA data set have a size between 1000 square feet and square feet. Reading summary statistics Homework Unanswered o In regards to the SIZE of houses in the HOUSEDATA data set, the largest house is square feet Name Answers Using R for summary statistics Homework Unanswered For this question, look at the results of the summary(HOUSEDATA) on your own computer, where the summary statistics for all variables in the data set are given. find the variable AGE, which represents the age of a house, in years. For the variable AGE, the 25th percentile (1st Quartile) of AGE is years. Numeric Answer Using R for summary statistics. Homework.Unanswered For this question, look at the results of the summary(HOUSEDATA) on your own computer, where the summary statistics forall variables in the data set are given. Find the variable LOCATION, which is a categorical variable whose values are either North or South How does RStudio display results for LOCATION when we use the command summary(HOUSEDATA)? COM A RStudio gives three lines of output about the variable LOCATION - length:400, class:character, and mode:character. B RStudio gives numbers how many houses fall into each category. The summary(HOUSEDATA) command indicates that there are 164 houses in the North and 236 houses in the South, RStudio gives percentages of houses that fall into each category. The summary[HOUSEDATA) command indicates that 41% of houses in the data are in the North, and 594 of houses in the data are in the South OHL 1188 mumere Variables 3rd Qu.:22.80 Max. :33.90 3rd Qu.:8.000 Max 38.000 11 me Messgailon DAN ht Screenshot of Rstudio after turning the two commands above The first variable, mpg, is a quantitative variable representing miles per gallon. From the summary output, we see that the cars in the data set have fuel economy that range from 10.40 to 33 90 miles per gallon, where the median fuel economy in the data is 19 20 miles per gallon summary() in RStudio Homework Unanswered . Look at the output of the commands helpimtcars) and summary(mtcars) on your computer, First determine the name of the variable that represents Rear axle ratio Iyou will find this from using the help/mtcars) command). Now that you know the name of the variable that represents the rear axle ratio find the summary statistics for the variable representing Real axle ratio in the summarylmtcars) output. The median Rear axle ratio is Please use the same number of decimal places that you see in the RStudio output.) mensen
Step by Step Solution
There are 3 Steps involved in it

Get step-by-step solutions from verified subject matter experts