

Question: LAB 3 ASSIGNMENT INFERENCES FOR CATEGORICAL DATA In this lab assignment, you will apply the summary and inferential tools for categorical data in Excel to
LAB 3 ASSIGNMENT
INFERENCES FOR CATEGORICAL DATA
In this lab assignment, you will apply the summary and inferential tools for categorical data in Excel to data from a restaurant in Edmonton. In particular, you will obtain summary statistics to describe the data and confidence intervals for the proportion of customers who would recommend this restaurant. You will also make inferences about the difference in the proportion of customers who would recommend this restaurant during peak hours or off-peak hours. In addition, we will observe which section of the menu the customers are most interested in. Finally, the relationship between the customers' preference of the menu section and their recommendation of the restaurant is examined. The assumptions required to make the inferences valid will be discussed as well.
Restaurant
The local restaurant owner wants to learn about the satisfaction of his customers on his lunch menu. His restaurant usually serves over 50 customers each day during lunch. He decided to ask all his servers to include a survey card in the check folder at the end of their lunch meal over 3 months. This survey card includes only 3 questions:
a)Did you visit during peak hours (noon to 1pm)?
b)Which section of the menu (Appetizer/Main Dish/Dessert) do you like the most?
c)Will you recommend this restaurant to others?
By the end of the survey period, the owner collected 150 responses. The data are available in the Excel file lab3.xlsx. The data are not to be printed in your submission
The following is a description of the variables in the data file:
Variable
Description of Variable
Peak Hour
Yes or No,
Menu
Preference of the menu (Appetizer/Main Dish/Dessert)
Response
Recommend or Not recommend the restaurant to others.
1.First, you will discuss the survey design.
(a)What are possible sources of bias in the survey? Explain briefly.
(b)Can we generalize the results of the survey to all customers in this restaurant?
2.Now you will display and summarize the data with a bar chart and frequency table. Tips: Use the PivotTable feature to obtain answers for this question.
(a)Obtain a relative frequency bar chart of response (recommend or not recommend) for the 150 survey. Paste the plot into your report.
(b)Obtain a frequency table of response (showing both frequency and relative frequency). Paste the table into your report. What was the sample proportion of customers that will recommend the restaurant to others? What was the sample proportion of customers that will not recommend the restaurant to others?
1
3.Now you will estimate the proportion of customers that will recommend the restaurant to others with 95% confidence interval.
Tips: There is no function in Excel that can do it for you, so you need to calculate all values by yourself.
(a)Obtain and interpret a 95% confidence interval for the proportion of customers that will recommend the restaurant to others.
(b)What are the assumptions required to make the inferences in part (a) valid? Are the assumptions met in this case? Explain briefly.
4.Now you will examine the change in the proportion of customers that will recommend the restaurant to others between peak hours and non-peak hours.
(a)Is there evidence that the restaurant owner has seen a change in the proportion of customers that will recommend the restaurant to others between peak hours and non-peak hours? Obtain a contingency table (using the PivotTable feature) of the count of recommendations and not recommendations by peak hours. Paste the table into your report.
(b)Refer to the output in part (a) to answer the following questions: What percent of customers that would recommend the restaurant came during peak hours? What percent of customers that would recommend the restaurant didn't come during peak hours?
(c)Carry out the appropriate two-sample proportion test at the 5% significance level to answer the question. Paste the corresponding output into your report. In particular, state the null and alternative hypotheses, report the value of the test statistic, its distribution under the null hypothesis, and the p-value of the test. State your conclusions.
(d)Obtain and interpret a 95% confidence interval for the difference in the proportion of customers that will recommend the restaurant to others between peak hours and non-peak hours. Paste the output into your report. What is the estimated difference in the proportions? Is the interval consistent with the conclusion reached in part (a)?
(e)Are the assumptions for inference in parts (a) and (b) met in this case? Refer to theory to answer the question.
(f)Is there evidence that the restaurant owner has seen a change in the proportion of customers that will recommend the restaurant to others between peak hours and non-peak hours? Carry out the appropriate chi-square test for homogeneity at the 5% significance level to answer the question. Paste the corresponding output into your report. In particular, state the null and alternative hypotheses, report the value of the test statistic, its distribution under the null hypothesis, and the p-value of the test. State your conclusions.
(g)What is the relationship between the tests in parts (a) and (d)? Particularly, comment on the relationship between their test statistic values, p-values, and conclusions.
2
5.Now you will examine the relationship between customers' preference section of the menu and their recommendation of the restaurant. Using = 0.01, carry out an appropriate test to test if there is a relationship between customers' preference section of the menu and their recommendation of the restaurant. State the null and alternative hypotheses, report the value of the test statistic, its distribution under the null hypothesis, and the p-value of the test. State your conclusions.
3
LAB 3 ASSIGNMENT MARKING SCHEMA
Proper Header and appearance: 10 points
Question 1 (4)
(a)Sources of bias: 2 points
(b)Generalization to all customers: 2 points
Question 2 (10)
(a)Relative frequency bar chart: 4 points
(b)Frequency table: 2 points
Overall proportion: 2 points
(c)the sample proportion of customers that will recommend the restaurant to others: 1 point
the sample proportion of customers that will not recommend the restaurant to others: 1 point
Question 3 (9)
(a)Confidence interval for the proportion: 2 points
Interpretation of interval: 2 points
(b)Stating the inference assumptions: 2 points
Discussion of assumptions for our data: 3 points
Question 4 (46)
(a)Contingency table: 4 points
(b)Percentages for the recommended customers: 4 points (2 points each)
(c)Output: 2 points
Hypotheses: 2 points
Test statistic: 2 point
Distribution of the test statistic under the null hypothesis: 2 points
P-value: 2 points
Conclusions: 2 points
(d)C.I. output: 2 points
Interpretation of interval: 2 points
Estimated difference in the proportions: 2 points
Consistency of the confidence interval with the test in part (a): 2 points
(e)Discussing of assumptions for our data: 2 points
(f)Contingency table output: 2 points
Hypotheses: 2 points
Test statistic: 2 point
Distribution of the test statistic under the null hypothesis: 2 points
P-value: 2 points
Conclusions: 2 points
(g)The relationship between the tests in parts (a) and (d): 4 points
Question 5 (10)
Hypotheses: 2 points
Test statistic: 2 point
Distribution of the test statistic under the null hypothesis: 2 points
P-value: 2 points
Conclusions: 2 points
TOTAL=10+4+10+9+46+10=89
I have attached the data in PNG form as I don't have any other option. Please provide me a solution asap as I need to submit this within 1 hour.
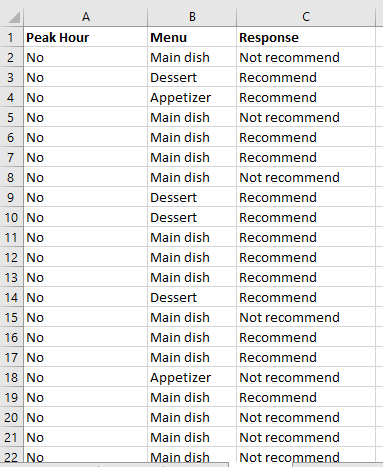
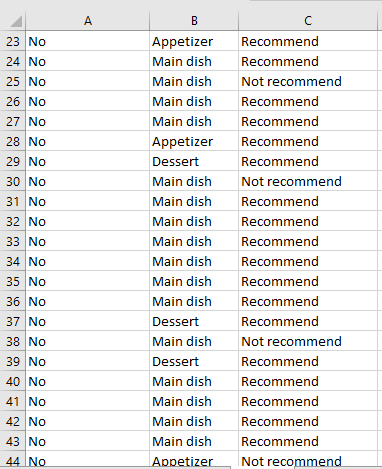
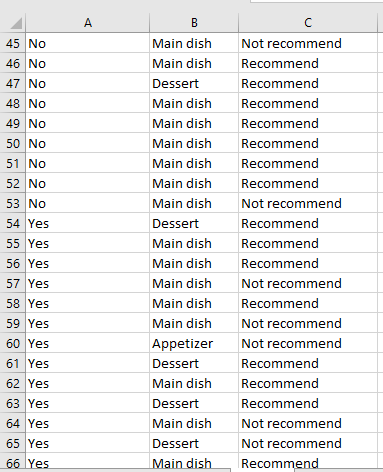
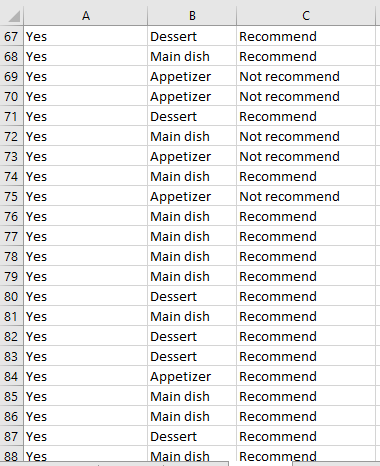
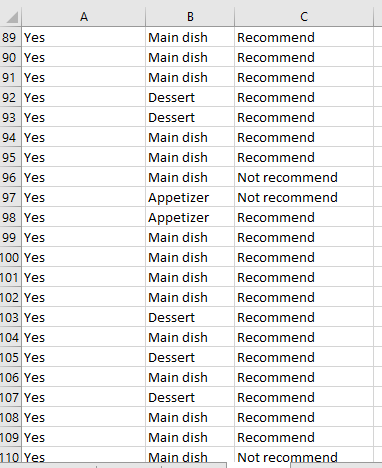
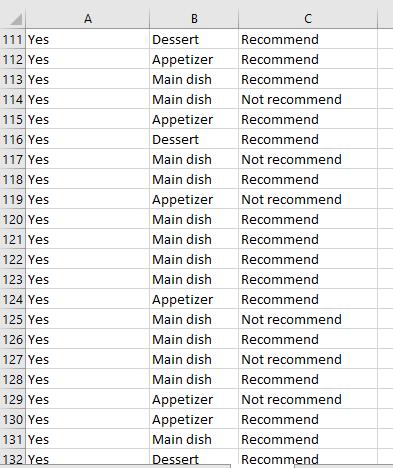
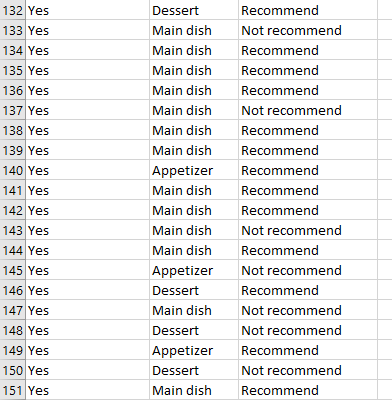
Peak Hour Menu Response No Main dish Not recommend No Dessert Recommend No ppetizer Recommend No Main dish Not recommend No Main dish Recommend No Main dish Recommend No Main dish Not recommend No Dessert Recommend No Dessert Recommend No Main dish Recommend No Main dish Recommend No Main dish Recommend No Dessert Recommend No Main dish Not recommend No Main dish Recommend No Main dish Recommend No ppetizer Not recommend No Main dish Recommend No Main dish Not recommend No Main dish Not recommend Not recommend Appetizer Recommend Main dish Recommend Main dish Not recommend Main dish Recommend Main dish Recommend appetizer Re commend Dessert Recommend Main dish Not recommend Main dish Recommend Main dish Recommend Main dish Recommend Main dish Recommend Main dish Recommend Main dish Recommend Dessert Recommend Main dish Not recommend Dessert Recommend Main dish Recommend Main dish Recommend Main dish Recommend Main dish Recommend Not recommend No Main dish Not recommend No Main dish Recommend No Dessert Recommend No Main dish Recommend No Main dish Recommend No Main dish Recommend No Main dish Recommend No Main dish Recommend No Main dish Not recommend Yes Dessert Recommend Yes Main dish Recommend Yes Main dish Recommend Yes Main dish Not recommend Yes Main dish Recommend Yes Main dish Not recommend Yes appetizer Not recommend Yes Dessert Recommend Yes Main dish Recommend Yes Dessert Recommend Yes Main dish Not recommend Yes Dessert Not recommend Recommend A B C 67 Yes Dessert Recommend 68 Yes Main dish Recommend 69 Yes Appetizer Not recommend 70 Yes Appetizer Not recommend 71 Yes Dessert Recommend 72 Yes Main dish Not recommend 73 Yes Appetizer Not recommend 74 Yes Main dish Recommend 75 Yes Appetizer Not recommend 76 Yes Main dish Recommend 77 Yes Main dish Recommend 78 Yes Main dish Recommend 79 Yes Main dish Recommend 80 Yes Dessert Recommend 81 Yes Main dish Recommend 82 Yes Dessert Recommend 83 Yes Dessert Recommend 84 Yes Appetizer Recommend 85 Yes Main dish Recommend 86 Yes Main dish Recommend 87 Yes Dessert Recommend 88 Yes Main dish RecommendMain dish Recommend Main dish Recommend Main dish Recommend Dessert Recommend Dessert Recommend Main dish Recommend Main dish Recommend Main dish Not recommend hppetizer Not recommend Appetizer Recommend Main dish Recommend Main dish Recommend Main dish Recommend Main dish Recommend Dessert Recommend Main dish Recommend Dessert Recommend Main dish Recommend Dessert Recommend Main dish Recommend Main dish Recommend Not recommend Dessert Recommend Appetizer Re comm e n d Main dish Recommend Main dish Not recommend Appetizer Recommend Dessert Recommend Main dish Not recommend Main dish Recommend Appetizer Not recommend Main dish Recommend Main dish Recommend Main dish Recommend Main dish Recommend Appetizer Re comm e n d Main dish Not recommend Main dish Recommend Main dish Not recommend Main dish Recommend Appetizer Not recommend Appetizer Recommend Main dish Recommend Recommend Dessert Main dish Main dish Main dish Main dish Main dish Main dish Main dish Appetizer Main dish Main dish Main dish Main dish Appetizer Dessert Main dish Dessert Appetizer Dessert Main dish Recommend Not recommend Recommend Recommend Recommend Not recommend Recommend Recommend Recommend Recommend Recommend Not recommend Recommend Not recommend Recommend Not recommend Not recommend Recommend Not recommend Recommend
Step by Step Solution
There are 3 Steps involved in it

Get step-by-step solutions from verified subject matter experts