

Question: Lab 3 Project - Excel Ch 6 Open the start file On the Sales Data worksheet, enter a formula in cell J4 to find the
Lab 3 Project - Excel Ch 6
- Open the start file
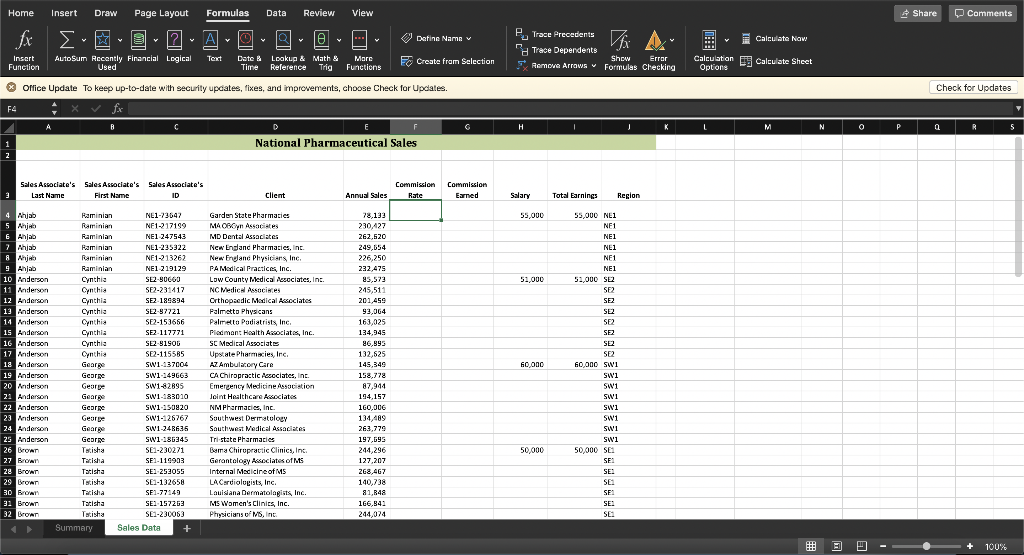
- On the Sales Data worksheet, enter a formula in cell J4 to find the sales associate's region by extracting the first three characters of the sales associate's ID in cell C4. Use cell references where appropriate. Fill the formula down through cell J64.
- On the Sales Data worksheet, calculate the commission rate and commission paid for each sales associate.
- Beginning in cell F4, enter a formula using the IFS function to calculate the commission rate based on the following table. Hint: Do not include comma separators in numerical values in formulas. Excel interprets commas as function argument separators.
Table displays calculations for commission rates based on annual sales. IF ANNUAL SALES ARE: THEN THE COMMISSION RATE IS: >=225,000 6% >=175,000 4% >=100,000 2% 0% - Fill the formula down through cell F64. If necessary, format the range as a percentage, and center the values in the cells.
- In cell G4, calculate the commission earned by multiplying the annual sales by the commission rate (E4*F4).
- Add a rounding function to the formula in cell G4 to round the result to two decimal places.
- Fill the formula down through cell G64. If necessary, format the range using the default Comma Style number format.
- Beginning in cell F4, enter a formula using the IFS function to calculate the commission rate based on the following table. Hint: Do not include comma separators in numerical values in formulas. Excel interprets commas as function argument separators.
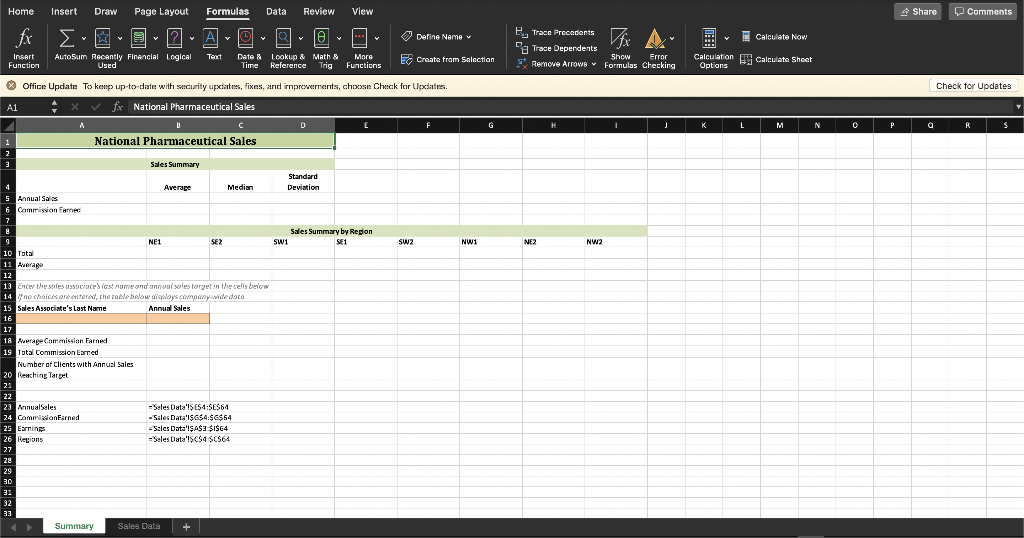
- In the Summary sheet, calculate average and median sales and commissions. Use the named ranges shown in cells A23:B26.
- In cell B5, enter a formula to calculate the average annual sales for all sales associates. Use the named range AnnualSales.
- In cell C5, enter a formula to calculate the median annual sales for all sales associates. Use the named range AnnualSales.
- In cell D5, enter a formula to calculate the standard deviation for sales. This dataset is a sample of the larger population. Use the named range AnnualSales.
- Add a rounding function to the formula in cell D5 to round the result to two decimal places.
- In cell B6, enter a formula to calculate the average commission. Use the named range CommissionEarned.
- In cell C6, enter a formula to calculate the median commission. Use the named range CommissionEarned.
- In cell D6, enter a formula to calculate the standard deviation for commissions. This dataset is a sample of the larger population. Use the named range CommissionEarned.
- Add a rounding function to the formula in cell D6 to round the result to two decimal places.
- If necessary, format cells B5:D6 with the default Accounting Number Format.
- Calculate the total and average sales by region.
- In cell B10, use a SUMIF formula to calculate the sum of AnnualSales where the value in the Regions named range is equal to the region listed in cell B9.
- Copy the formula to cells C10:I10.
- In cell B11, use an AVERAGEIF formula to calculate the average of AnnualSales where the value in the Regions named range is equal to the region listed in cell B9.
- Add a rounding function to the formula in cell B11 to round the result to two decimal places.
- Copy the formula to cells C11:I11.
- If necessary, format cells B10:I11 with the default Accounting Number Format.
- The second part of the Summary sheet contains a sales associate lookup form, but the appropriate formulas have not been entered yet.
- In cell B18, enter a formula to calculate the average commission earned for the sales associate last name entered in cell A16. (Hint: Use a database function. Use the named range Earnings as the Database argument and the column label Commission Earned as the Field argument. The criteria range should be A15:B16.)
- In cell B19, enter a formula to calculate the total commission earned for that same sales associate. (Hint: Use a different database function. The function arguments are the same as those you used in step 7a.)
- If necessary, apply the Accounting Number Format to cells B18:B19.
- In cell B20, enter a formula to calculate the number of clients the sales associate had with annual sales reaching the target set in cell B16. (Hint: This time, use the column label Client as the Field argument. The criteria range should be A15:B16.) Remember, the values in the Client field are text values. Use the appropriate function.
- If necessary, apply the General number format to cell B20.
- Test your formulas by entering Lopez as the sales associate's last name (cell A16) and >200000 as the sales target (cell B16).
- Add an IFERROR function to the formula in cell B18 to display the error text Associate not found.
- If you receive errors, use Evaluate Formula to troubleshoot your formulas.
Step by Step Solution
There are 3 Steps involved in it
1 Expert Approved Answer
Step: 1 Unlock

Question Has Been Solved by an Expert!
Get step-by-step solutions from verified subject matter experts
Step: 2 Unlock
Step: 3 Unlock