

Question: Lab 4: Times series analysis and forecasting 1. Consider the following time series data, a. fill in the table below using the naive method (most
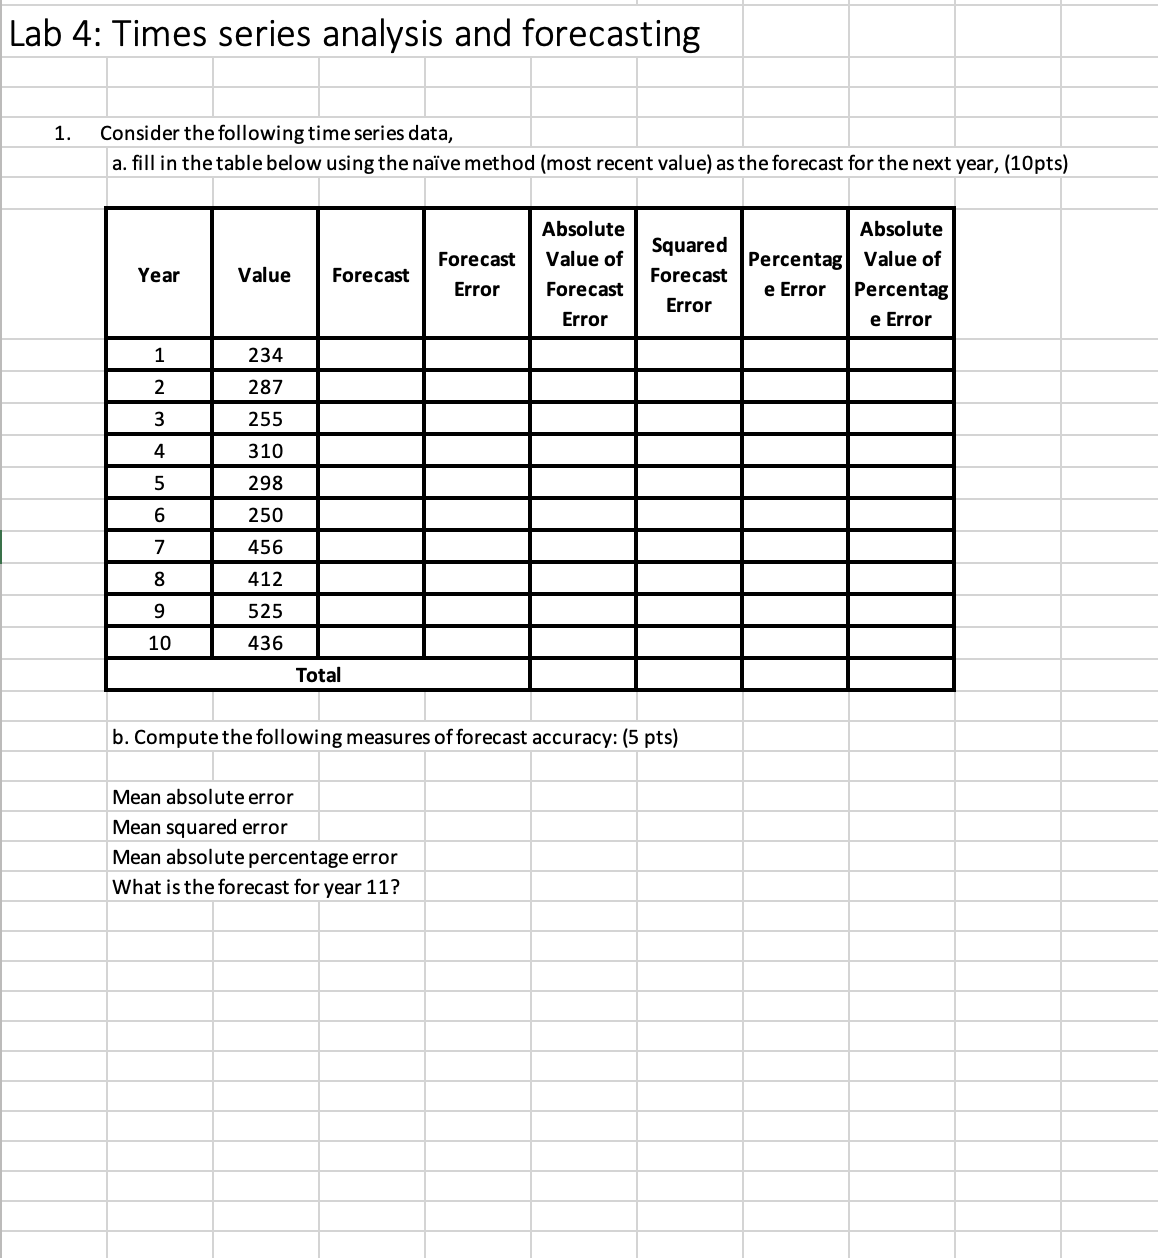
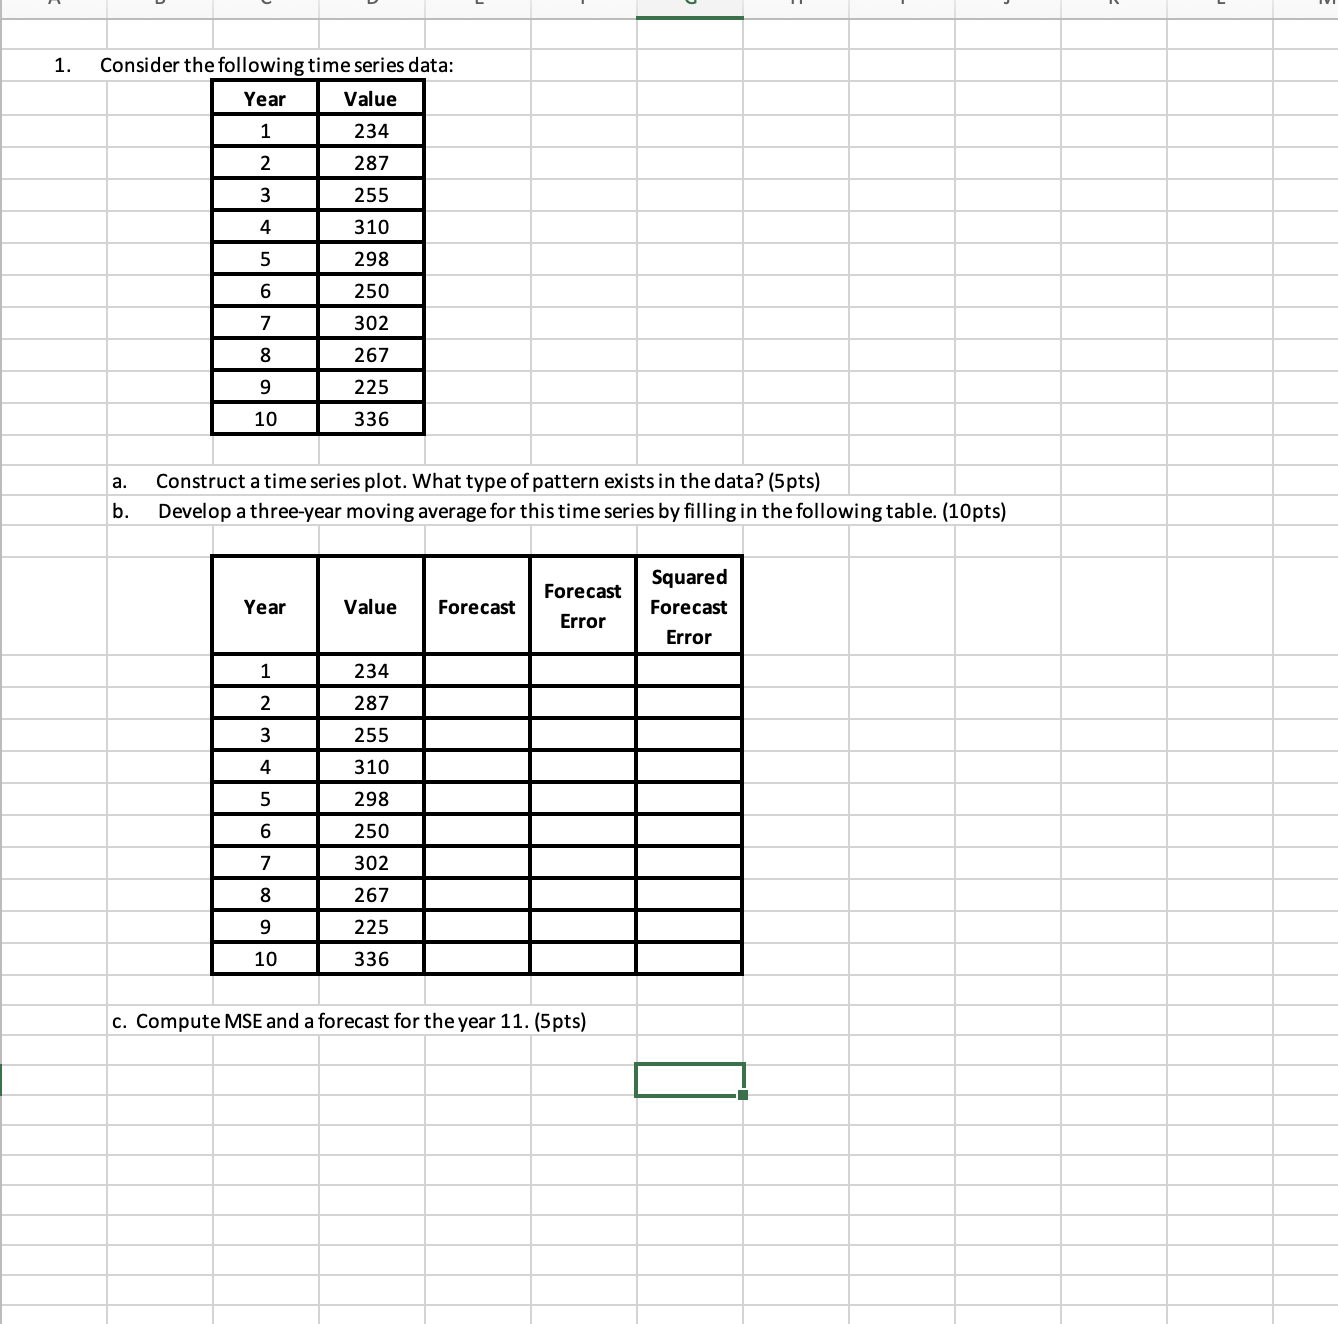
Lab 4: Times series analysis and forecasting 1. Consider the following time series data, a. fill in the table below using the naive method (most recent value) as the forecast for the next year, (10pts) Absolute s d Absolute uare Forecast | Value of 9 Percentag| Value of Year Value Forecast Error Forecast e Error |Percentag Error Error e Error - s | =2s I 1 1 1 | b. Computethe following measures of forecast accuracy: (5 pts) Mean absolute error Mean squared error Mean absolute percentage error What is the forecast for year 117 1. Consider the following time series data: Year Value 1 234 287 W N 255 310 298 6 250 7 302 267 225 10 336 a. Construct a time series plot. What type of pattern exists in the data? (5pts) b. Develop a three-year moving average for this time series by filling in the following table. (10pts) Squared Forecast Year Value Forecast Forecast Error Error 1 234 287 IN 3 255 310 298 6 250 302 8 267 225 10 336 c. Compute MSE and a forecast for the year 11. (5pts)
Step by Step Solution
There are 3 Steps involved in it

Get step-by-step solutions from verified subject matter experts