

Question: Lab Assignment and Report The lab report should include three parts: (1) schematic, (2) simulation results, (3) analysis A1 : Reconstruct the schematic as shown
Lab Assignment and Report
The lab report should include three parts: (1) schematic, (2) simulation results, (3) analysis
A1: Reconstruct the schematic as shown in Fig 2.5. Set 45 = 200 where L = 0.18 um. Use the simulation result to determine Vt, Id, gm and Rds. (DON't NEED TO ANSWER THIS QUESTION)
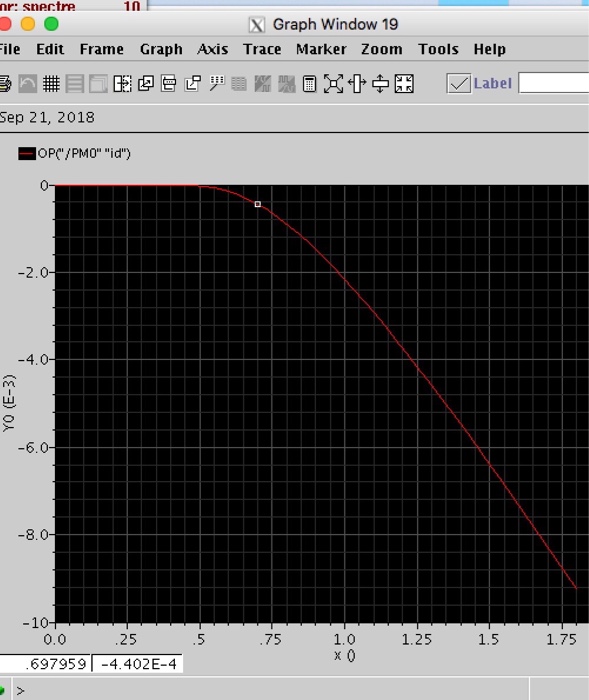
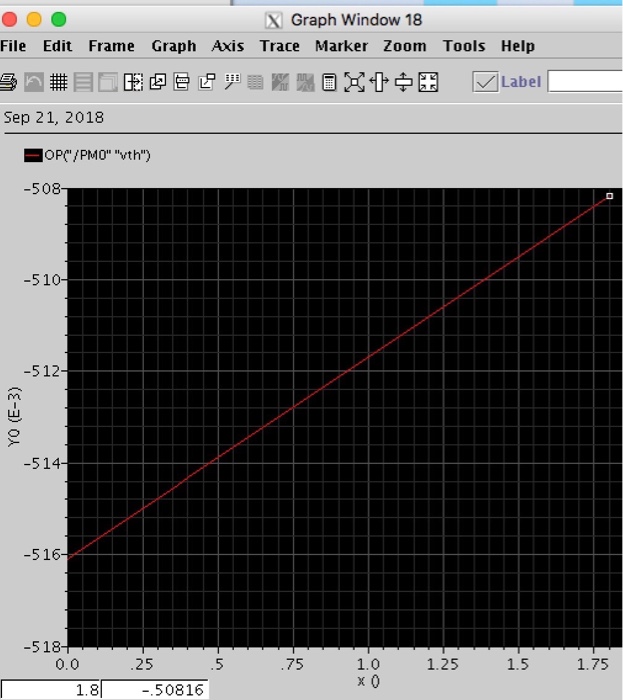
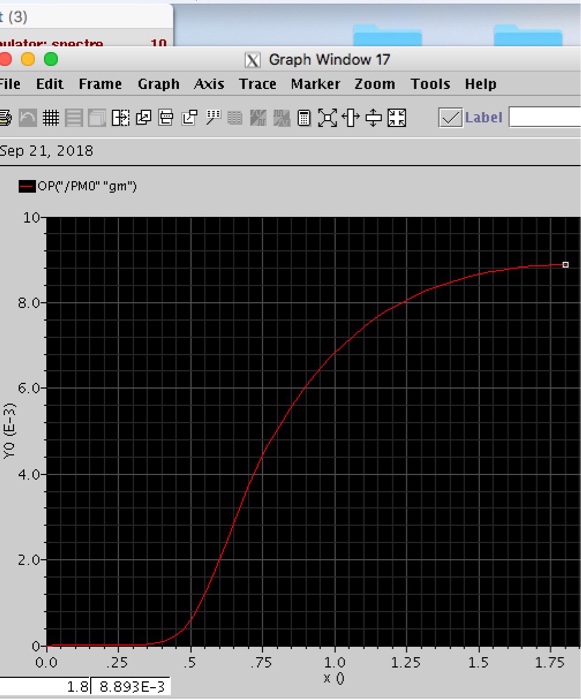
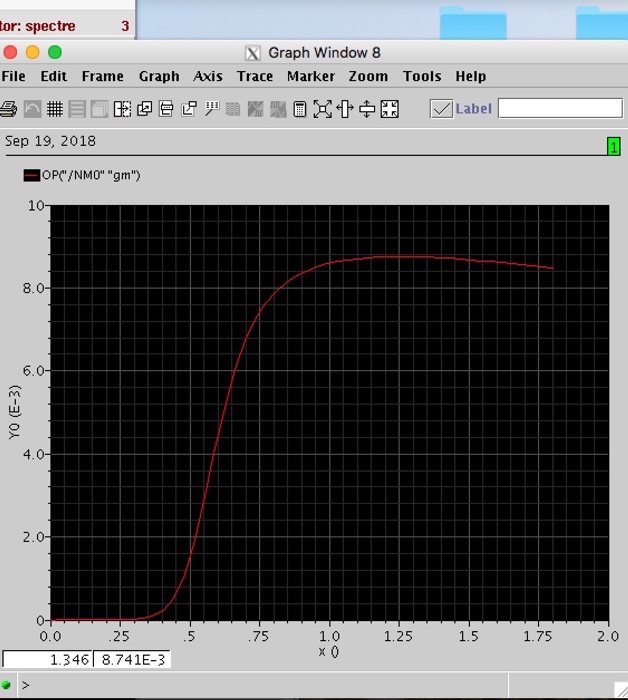
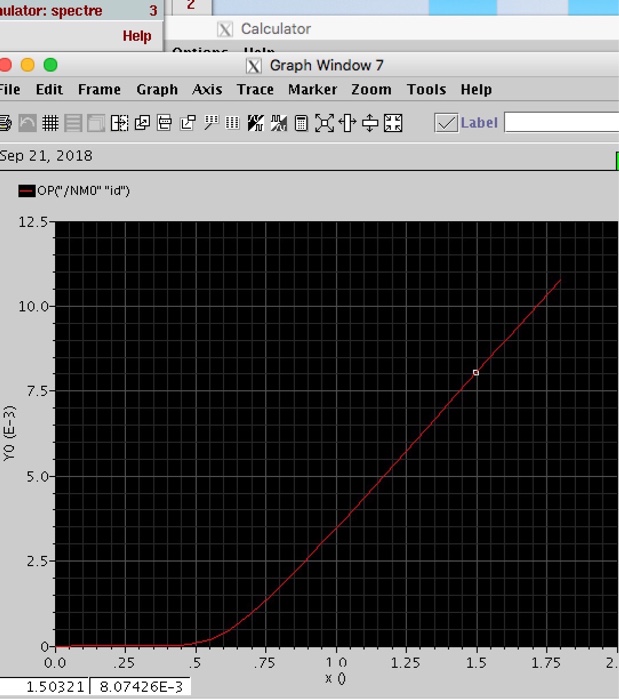
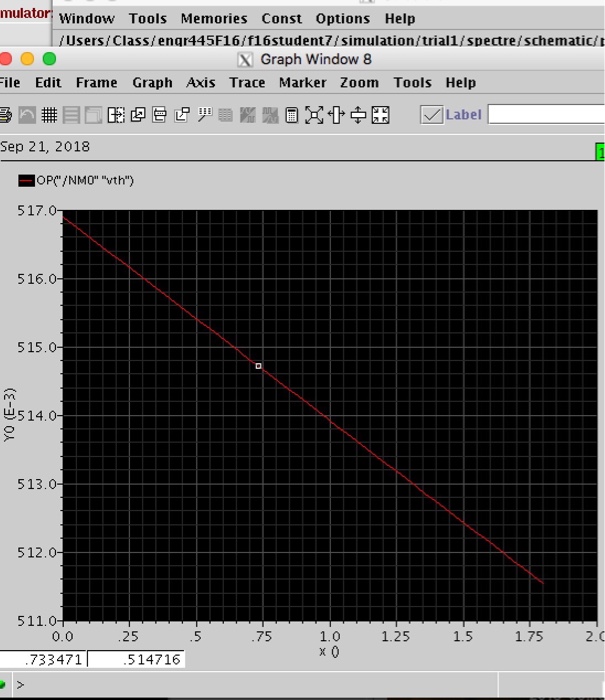
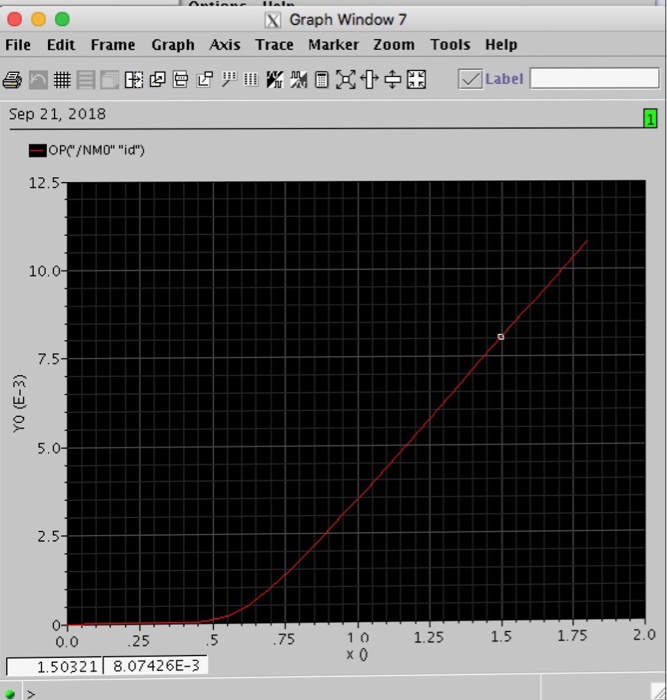
A2: In MATLAB or EXCEL, plot (1) Id versus Vgs, (2) Vt versus Vgs, (3) gm versus Id/W, (4) Rds versus Id/W, (5) gmRds versus Id/W.
Vt is the threshold voltage, gate-to-source voltage (Vgs), drain-to-source voltage (Vds), Id is also a current density, Id/W is the current density, Rds=Ron which is the on-state resistor (output resistor) .
Those are the graphs from simulation but I need to them using MATLAB or Excel, can someone help me. I just need analyses of each graph and need to know how to graph on MATLAB or Excel.
% ------------------------------
% Plot data from .csv file
% ------------------------------
% Clear MATLAB Command windows and workspace, and close opened figure
clear all;
close all;
format short e;
% Load data file to MATLAB
data = csvread('#.csv'); % # is the name of the data file
variable_1 = data(:, 1); % first column of data
variable_2 = data(:, 2); % second column of data
% Keep adding the data column if needed
% Figure configurations (IEEE standard)
figure
set(0, 'DefaultFigureColor', [0.5 0.5 0.5]);
set(0, 'DefaultAxesFontSize', 14);
set(gcf, 'DefaultAxesYGrid', 'on');
set(gcf, 'DefaultAxesXGrid', 'on');
set(gcf, 'DefaultLineLineWidth', 1.5);
set(gcf, 'DefaultAxesLineWidth',1);
% Main function
plot(x_axis, y_axis);
grid on
xlim([A B])
ylim([A B])
xlabel('Name (unit)')
ylabel('Name (unit)')
%% End of MATLAB code
#PMOS_gm DATA
Waveform X,Waveform Y 0,0 0.03673469,3.44435452408475e-09 0.07346939,1.227444403190132e-08 0.1102041,3.75857754680065e-08 0.1469388,1.116836410509075e-07 0.1836735,3.257612179196847e-07 0.2204082,9.30020511899542e-07 0.2571429,2.577646797870705e-06 0.2938776,6.856759411959021e-06 0.3306122,1.730110649065505e-05 0.3673469,4.11247198217989e-05 0.4040816,9.220296990126471e-05 0.4408163,0.0001955675311821317 0.477551,0.0003894158514464389 0.5142857,0.0007139963256143225 0.5510204,0.001184626216864905 0.5877551,0.00177207734525236 0.6244898,0.002415670820653375 0.6612245,0.003056066067810495 0.6979592,0.003656129662766937 0.7346939,0.004201368816542439 0.7714286,0.004691142542949767 0.8081633,0.005130591548542647 0.844898,0.005526081502072256 0.8816327,0.005883357374326405 0.9183673,0.006207097719121361 0.955102,0.006501012737709596 0.9918367,0.006768077220747719 1.028571,0.007010745181668794 1.065306,0.007231107872759494 1.102041,0.007430998761575535 1.138776,0.007612059595156736 1.17551,0.007775781012132879 1.212245,0.00792352764139709 1.24898,0.008056554210984095 1.285714,0.008176016645846501 1.322449,0.00828298044864691 1.359184,0.008378427620740921 1.395918,0.008463262776178515 1.432653,0.008538318766199952 1.469388,0.008604361955102778 1.506122,0.008662097201309272 1.542857,0.008712172558673258 1.579592,0.008755183698899797 1.616327,0.008791678053422122 1.653061,0.008822158675360188 1.689796,0.00884708782588842 1.726531,0.008866890292928854 1.763265,0.008881956452970933 1.8,0.008892645088869519
#PMOS_Id DATA
Waveform X,Waveform Y 0,0 0.03673469,-1.192100685038703e-10 0.07346939,-4.253937937496309e-10 0.1102041,-1.306605885539545e-09 0.1469388,-3.903288916572053e-09 0.1836735,-1.148714319570724e-08 0.2204082,-3.327359060424701e-08 0.2571429,-9.434409447694257e-08 0.2938776,-2.596042042581502e-07 0.3306122,-6.861271323642894e-07 0.3673469,-1.726167104336863e-06 0.4040816,-4.116567171337316e-06 0.4408163,-9.31056129971899e-06 0.477551,-1.995603282929371e-05 0.5142857,-4.024059809478669e-05 0.5510204,-7.550045468389582e-05 0.5877551,-0.0001308568479631402 0.6244898,-0.0002096937925726074 0.6612245,-0.0003130782247241533 0.6979592,-0.0004402484680972985 0.7346939,-0.0005894850230769609 0.7714286,-0.0007587921105796227 0.8081633,-0.0009462528681848495 0.844898,-0.00115015206947539 0.8816327,-0.001368984947446288 0.9183673,-0.001601426714030098 0.955102,-0.001846296934728009 0.9918367,-0.00210253026550473 1.028571,-0.002369155268202709 1.065306,-0.002645279793830603 1.102041,-0.002930080909510763 1.138776,-0.003222797712272479 1.17551,-0.003522725887955803 1.212245,-0.003829213300085087 1.24898,-0.004141656190082335 1.285714,-0.004459495757526798 1.322449,-0.004782214999816648 1.359184,-0.005109335752211535 1.395918,-0.005440415901369295 1.432653,-0.005775046761105713 1.469388,-0.006112850605440681 1.506122,-0.00645347835599753 1.542857,-0.006796607420676563 1.579592,-0.007141939679609395 1.616327,-0.007489199613359353 1.653061,-0.007838132567433409 1.689796,-0.008188503146509344 1.726531,-0.008540093731367729 1.763265,-0.008892703111314383 1.8,-0.009246145224852889
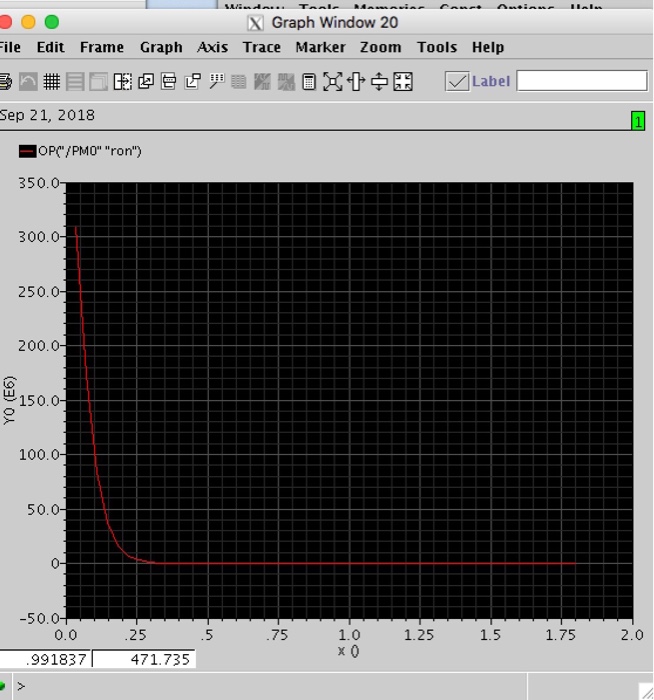
XGraph Window 20 ile Edit Frame Graph Axis Trace Marker Zoom Tools Help Sep 21, 2018 OPC/PM0" "ron") 350.0 300.0 250.0- 200.0 150.0 100.0 50.0 0 -50.0 1.0 1.25 1.5 1.75 2.0 0.0 .25 .75 991837 471.735 XGraph Window 20 ile Edit Frame Graph Axis Trace Marker Zoom Tools Help Sep 21, 2018 OPC/PM0" "ron") 350.0 300.0 250.0- 200.0 150.0 100.0 50.0 0 -50.0 1.0 1.25 1.5 1.75 2.0 0.0 .25 .75 991837 471.735
Step by Step Solution
There are 3 Steps involved in it

Get step-by-step solutions from verified subject matter experts