

Question: Lab Challenge: Predicting Speed along Ramp First: Use a motion detector to measure the acceleration of a cart down a ramp. Record your data
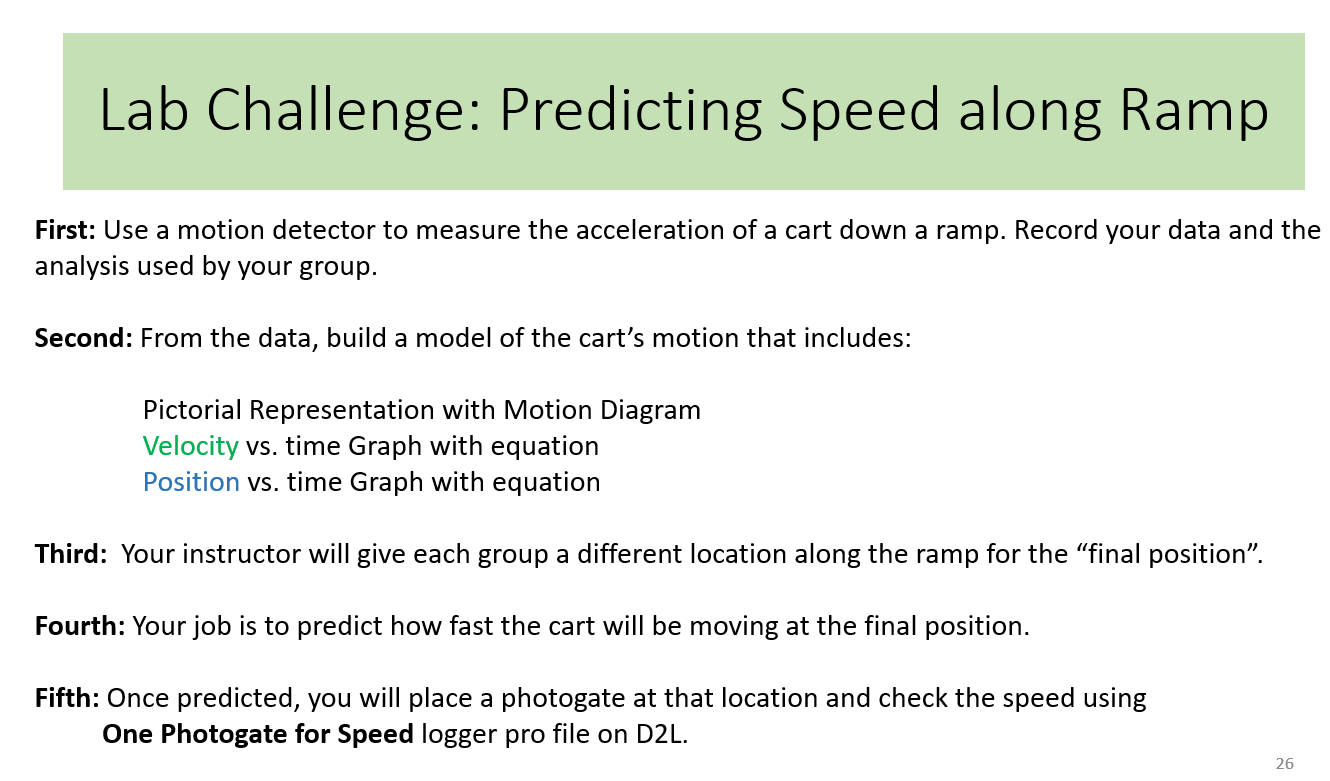
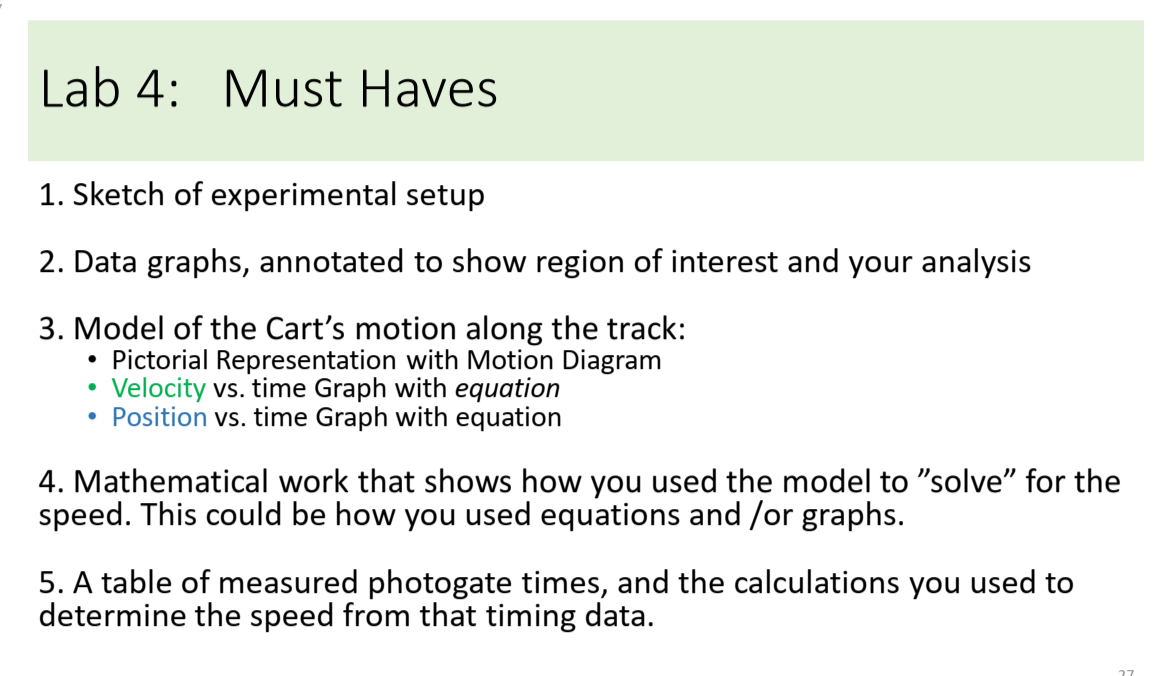
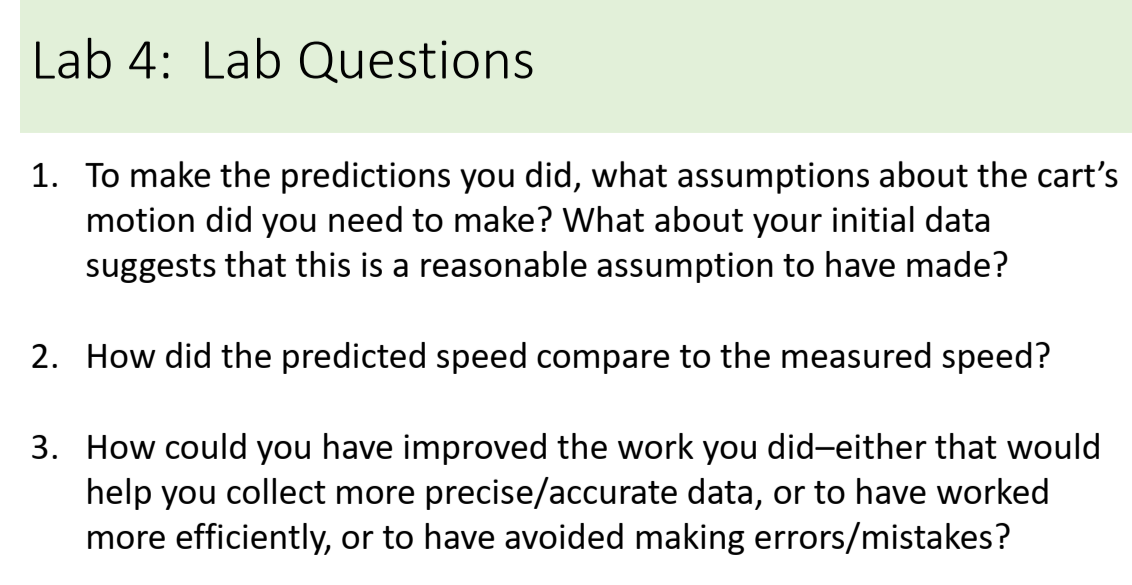
Lab Challenge: Predicting Speed along Ramp First: Use a motion detector to measure the acceleration of a cart down a ramp. Record your data and the analysis used by your group. Second: From the data, build a model of the cart's motion that includes: Pictorial Representation with Motion Diagram Velocity vs. time Graph with equation Position vs. time Graph with equation Third: Your instructor will give each group a different location along the ramp for the "final position". Fourth: Your job is to predict how fast the cart will be moving at the final position. Fifth: Once predicted, you will place a photogate at that location and check the speed using One Photogate for Speed logger pro file on D2L. 26 Lab 4: Must Haves 1. Sketch of experimental setup 2. Data graphs, annotated to show region of interest and your analysis 3. Model of the Cart's motion along the track: Pictorial Representation with Motion Diagram . Velocity vs. time Graph with equation Position vs. time Graph with equation 4. Mathematical work that shows how you used the model to "solve" for the speed. This could be how you used equations and /or graphs. 5. A table of measured photogate times, and the calculations you used to determine the speed from that timing data. Lab 4: Lab Questions 1. To make the predictions you did, what assumptions about the cart's motion did you need to make? What about your initial data suggests that this is a reasonable assumption to have made? 2. How did the predicted speed compare to the measured speed? 3. How could you have improved the work you did-either that would help you collect more precise/accurate data, or to have worked more efficiently, or to have avoided making errors/mistakes?
Step by Step Solution
There are 3 Steps involved in it

Get step-by-step solutions from verified subject matter experts