

Question: Lab E - Please help 10. Below is a graph of the position of a vehicle as it travels from Corvallis toward Seattle. The x-axis
Lab E - Please help
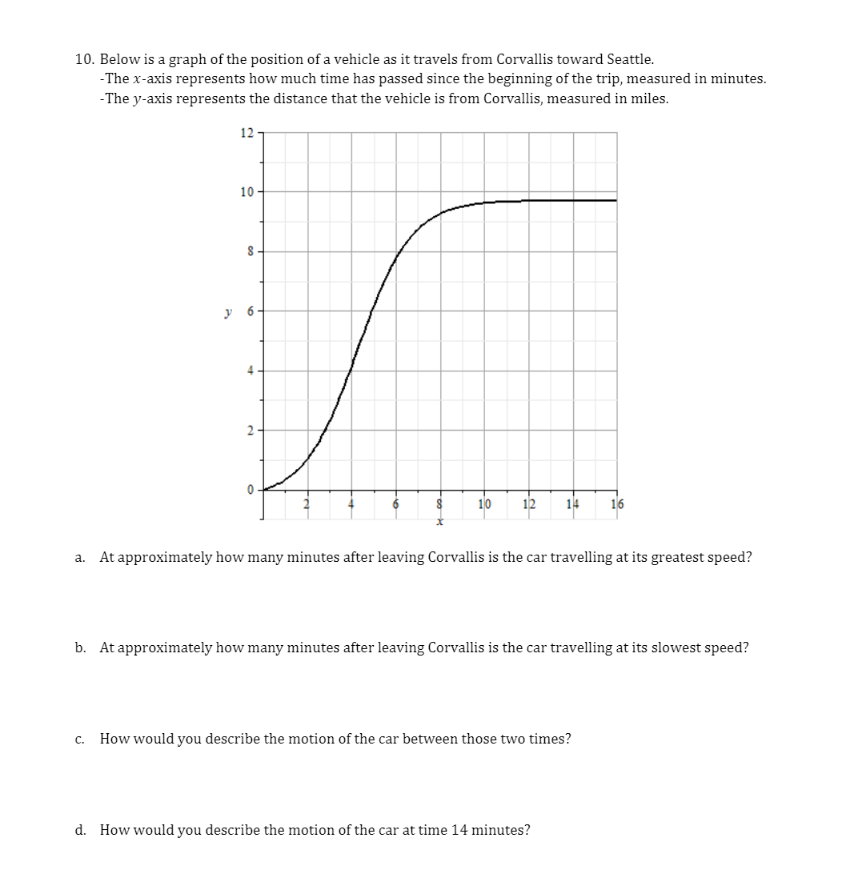
10. Below is a graph of the position of a vehicle as it travels from Corvallis toward Seattle. The x-axis represents how much time has passed since the beginning of the trip, measured in minutes. The y-axis represents the distance that the vehicle is from Corvallis, measured in miles. 12- 10 - 8 - 14 16 a. At approximately how many minutes after leaving Corvallis is the car travelling at its greatest speed? b. At approximately how many minutes after leaving Corvallis is the car travelling at its slowest speed? c. How would you describe the motion of the car between those two times? d. How would you describe the motion of the car at time 14 minutes
Step by Step Solution
There are 3 Steps involved in it

Get step-by-step solutions from verified subject matter experts