

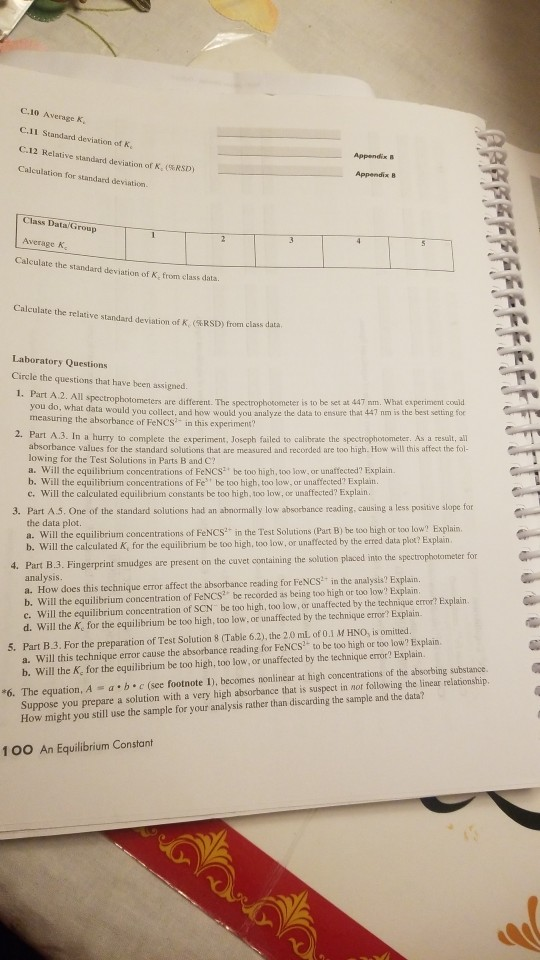
C.10 Average K, C.11 Standard deviation of K C.12 Relative standard deviation of K, (RSD) Calculation...
Fantastic news! We've Found the answer you've been seeking!
Question:
Transcribed Image Text:
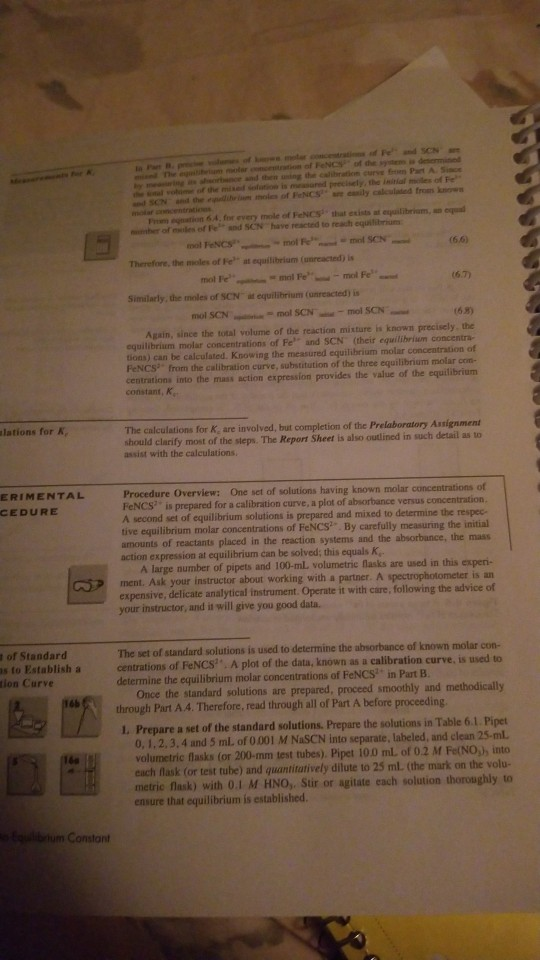
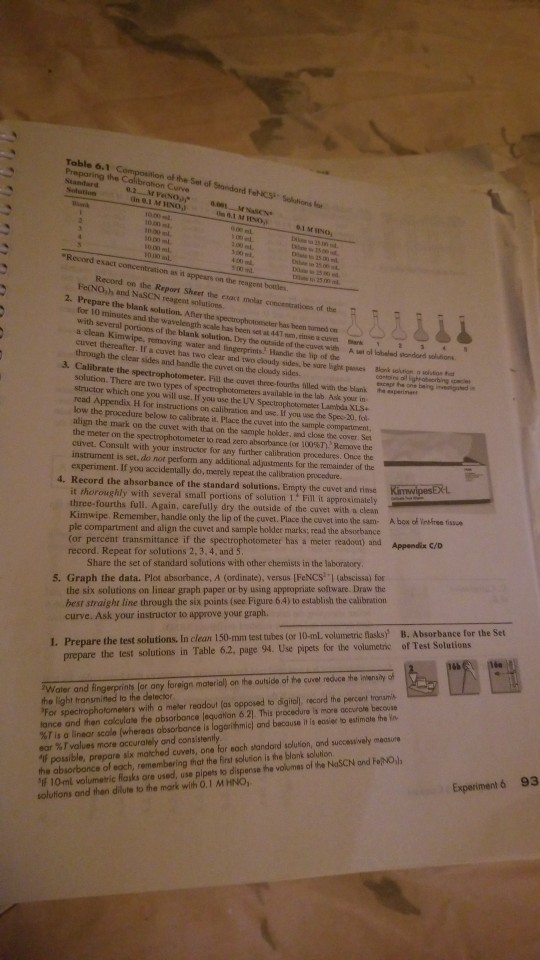
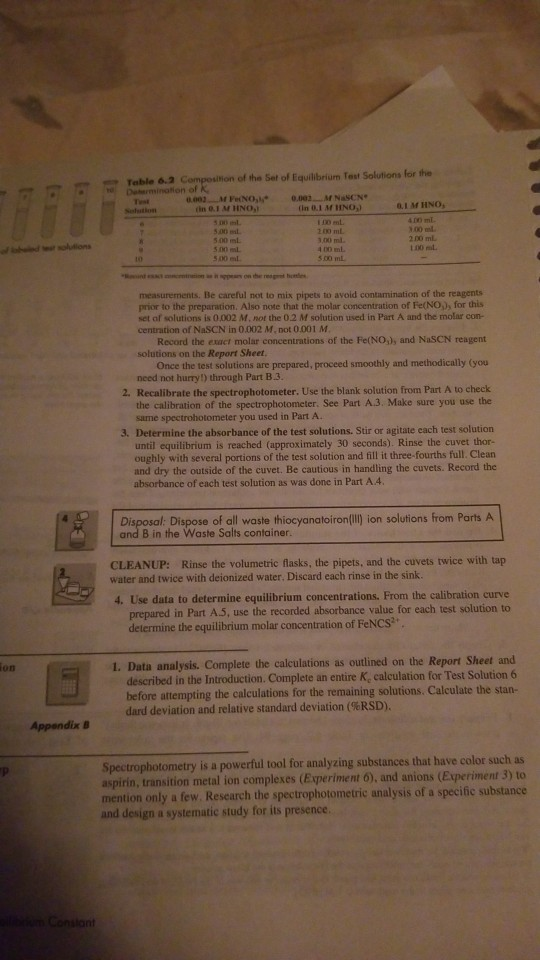
C.10 Average K, C.11 Standard deviation of K C.12 Relative standard deviation of K, (RSD) Calculation for standard deviation. Class Data/Group Average K Calculate the standard deviation of K, from class data. 2 Calculate the relative standard deviation of K. (RSD) from class data. Appendix B Appendix B Laboratory Questions Circle the questions that have been assigned. 1. Part A.2. All spectrophotometers are different. The spectrophotometer is to be set at 447 nm. What experiment could you do, what data would you collect, and how would you analyze the data to ensure that 447 nm is the best setting for measuring the absorbance of FeNCS in this experiment? 2. Part A.3. In a hurry to complete the experiment, Joseph failed to calibrate the spectrophotometer. As a result, all absorbance values for the standard solutions that are measured and recorded are too high. How will this affect the fol- lowing for the Test Solutions in Parts B and C? a. Will the equilibrium concentrations of FeNCS² be too high, too low, or unaffected? Explain. b. Will the equilibrium concentrations of Fe" be too high, too low, or unaffected? Explain. c. Will the calculated equilibrium constants be too high, too low, or unaffected? Explain. 3. Part A.5. One of the standard solutions had an abnormally low absorbance reading, causing a less positive slope for the data plot. a. Will the equilibrium concentrations of FENCS²* in the Test Solutions (Part B) be too high or too low? Explain. b. Will the calculated K, for the equilibrium be too high, too low, or unaffected by the erred data plot? Explain. 4. Part B.3. Fingerprint smudges are present on the cuvet containing the solution placed into the spectrophotometer for analysis. a. How does this technique error affect the absorbance reading for FeNCS² in the analysis? Explain. b. Will the equilibrium concentration of FeNCS be recorded as being too high or too low? Explain. c. Will the equilibrium concentration of SCN be too high, too low, or unaffected by the technique error? Explain. d. Will the K, for the equilibrium be too high, too low, or unaffected by the technique error? Explain. 5. Part B.3. For the preparation of Test Solution 8 (Table 6.2), the 2.0 mL of 0.1 M HNO, is omitted. a. Will this technique error cause the absorbance reading for FeNCS² to be too high or too low? Explain. b. Will the K, for the equilibrium be too high, too low, or unaffected by the technique error? Explain. *6. The equation, A=abc (see footnote 1), becomes nonlinear at high concentrations of the absorbing substance. Suppose you prepare a solution with a very high absorbance that is suspect in not following the linear relationship. How might you still use the sample for your analysis rather than discarding the sample and the data? 100 An Equilibrium Constant tarat alations for K for K ERIMENTAL CEDURE of Standard as to Establish a tion Curve 166 160 Equilibrium Constant la Par B. precise vilumes of knows moter concentrations of Fe and SCN are mind The equilibrium molar concentration of FeNCS of the system is determined by measuring its absorbance and then using the calibration curve from Part A. Since Isolation is measured precisely, the initial moles of Fe and SCN and the equilibrium moles of FeNCS are easily calculated from known From equation 64, for every mole of FeNCS that exists at equilibrium, an equal her of exules of Fe" and SCN have reacted to reach equilibrium mol SCN mol FENCS mol Fe Therefore, the moles of Fe" at equilibrium (unreacted) is mol Fe mal Fe-mol Fe Similarly, the moles of SCN at equilibrium (unreacted) is mol SCN (68) Again, since the total volume of the reaction mixture is known precisely, the equilibrium molar concentrations of Fe and SCN (their equilibrium concentra- tions) can be calculated. Knowing the measured equilibrium molar concentration of FeNCS from the calibration curve, substitution of the three equilibrium molar com- centrations into the mass action expression provides the value of the equilibrium constant, K mol SCN-mol SCN (6.6) (6.7) The calculations for K, are involved, but completion of the Prelaboratory Assignment should clarify most of the steps. The Report Sheet is also outlined in such detail as to assist with the calculations. Procedure Overview: One set of solutions having known molar concentrations of FeNCS is prepared for a calibration curve, a plot of absorbance versus concentration. A second set of equilibrium solutions is prepared and mixed to determine the respec- tive equilibrium molar concentrations of FeNCS. By carefully measuring the initial amounts of reactants placed in the reaction systems and the absorbance, the mass action expression at equilibrium can be solved; this equals K. A large number of pipets and 100-mL volumetric flasks are used in this experi- ment. Ask your instructor about working with a partner. A spectrophotometer is an expensive, delicate analytical instrument. Operate it with care, following the advice of your instructor, and it will give you good data. The set of standard solutions is used to determine the absorbance of known molar con- centrations of FeNCS. A plot of the data, known as a calibration curve, is used to determine the equilibrium molar concentrations of FeNCS in Part B. Once the standard solutions are prepared, proceed smoothly and methodically through Part A.4. Therefore, read through all of Part A before proceeding. 1. Prepare a set of the standard solutions. Prepare the solutions in Table 6.1. Pipet 0,1,2,3,4 and 5 ml. of 0.001 M NaSCN into separate, labeled, and clean 25-ml volumetric flasks (or 200-mm test tubes). Pipet 10.0 ml. of 0.2 M Fe(NO₂), into each flask (or test tube) and quantitatively dilute to 25 ml. (the mark on the volu- metric flask) with 0.1 M HNO,. Stir or agitate each solution thoroughly to ensure that equilibrium is established. Table 6.1 Composition of the Set of Standard FeNCS Solutions for Preparing the Calibration Curve Standard 6.2 M FENO in 0.1 M HNOJ 10:00 1000 m. 10:00 1000 ml 100 ml 6.001 M NasiCN On 0.1 M HNO 4:00. 100 ml 4:00 100 w 6.1 MUNG, 25 16 d. 2500 Dato 2500 ml. Dato 25 10 v. "Record exact concentration as it appears on the reagent bottles. Record on the Report Sheet the exact molar concentrations of the Fe(NO) and NaSCN reagent solutions. 2. Prepare the blank solution. After the spectrophotometer has been turned on for 10 minutes and the wavelength scale has been set at 447 m, rinse a cuvet with several portions of the blank solution. Dry the outside of the cuvet with a clean Kimwipe, removing water and fingerprints Handle the lip of the cuvet thereafter. If a cuvet has two clear and two cloudy sides, be sure light passes through the clear sides and handle the cuvet on the cloudy sides. iiiiii 1 A set of labeled standard solutions 3. Calibrate the spectrophotometer. Fill the cuvet three-fourths filled with the blank solution. There are two types of spectrophotometers available in the lab. Ask your in structor which one you will use. If you use the UV Spectrophotometer Lambda XLS+ read Appendix H for instructions on calibration and use. If you use the Spec-20, fol low the procedure below to calibrate it. Place the cuvet into the sample compartment, align the mark on the cuvet with that on the sample holder, and close the cover. Set the meter on the spectrophotometer to read zero absorbance (or 100%7). Remove the cuvet. Consult with your instructor for any further calibration procedures. Once the instrument is set, do not perform any additional adjustments for the remainder of the experiment. If you accidentally do, merely repeat the calibration procedure. contains lighaberbing spaces except the one being invested 4. Record the absorbance of the standard solutions. Empty the cuvet and rinse it thoroughly with several small portions of solution 1. Fill it approximately three-fourths full. Again, carefully dry the outside of the cuvet with a clean Kimwipe. Remember, handle only the lip of the cuvet. Place the cuvet into the sam- ple compartment and align the cuvet and sample holder marks; read the absorbance (or percent transmittance if the spectrophotometer has a meter readout) and record. Repeat for solutions 2, 3, 4, and 5. Share the set of standard solutions with other chemists in the laboratory. 5. Graph the data. Plot absorbance, A (ordinate), versus [FeNCS] (abscissa) for the six solutions on linear graph paper or by using appropriate software. Draw the best straight line through the six points (see Figure 6.4) to establish the calibration curve. Ask your instructor to approve your graph. KimwipesEX-L A box of lintfree fissue Appendix C/D 1. Prepare the test solutions. In clean 150-mm test tubes (or 10-ml. volumetric flasks) prepare the test solutions in Table 6.2, page 94. Use pipets for the volumetric Water and fingerprints for any foreign material) on the outside of the cuvet reduce the intensity of the light transmitted to the detector. For spectrophotometers with a meter readout (as opposed to digitall, record the percent transmis tance and then calculate the absorbance Jequation 6.21. This procedure is more accurate because %T is a linear scale (whereas absorbance is logarithmic) and because it is easier to estimate the lin ear %T values more accurately and consistently 19⁰0 B. Absorbance for the Set of Test Solutions 166( If possible, prepare six matched cuvets, one for each standard solution, and successively measure the absorbance of each, remembering that the first solution is the blank solution. F 10-ml volumetric flasks are used, use pipets to dispense the volumes of the NaSCN and Fe(NO solutions and then dilute to the mark with 0.1 M HNO, 160 Experiment 6 93 ion ed test solutions Appendix B librium Constant Table 6.2 Composition of the Set of Equilibrium Test Solutions for the Determination of K Test 7 10 0.002 M Fe(NO₂ (in 0.1 M HNO₂) 500 ml 5.00 ml. 5.00 ml 500 ml 500 ml. 0.002 M NASCN (in 0.1 M HNO₂) 100 ml. 200 ml. 3,00 ml. 400 ml. 5.00 ml. Q.1 MHNO, 100 ml 2.00 ml. 100 mL measurements. Be careful not to mix pipets to avoid contamination of the reagents prior to the preparation. Also note that the molar concentration of Fe(NO), for this set of solutions is 0.002 M, not the 0.2 M solution used in Part A and the molar con- centration of NaSCN in 0.002 M, not 0.001 M. Record the exact molar concentrations of the Fe(NO,), and NaSCN reagent solutions on the Report Sheet. Once the test solutions are prepared, proceed smoothly and methodically (you need not hurry!) through Part B.3. 2. Recalibrate the spectrophotometer. Use the blank solution from Part A to check the calibration of the spectrophotometer. See Part A.3. Make sure you use the same spectrohotometer you used in Part A. 3. Determine the absorbance of the test solutions. Stir or agitate each test solution until equilibrium is reached (approximately 30 seconds). Rinse the cuvet thor- oughly with several portions of the test solution and fill it three-fourths full. Clean and dry the outside of the cuvet. Be cautious in handling the cuvets. Record the absorbance of each test solution as was done in Part A4. Disposal: Dispose of all waste thiocyanatoiron (III) ion solutions from Parts A and B in the Waste Salts container. CLEANUP: Rinse the volumetric flasks, the pipets, and the cuvets twice with tap water and twice with deionized water. Discard each rinse in the sink. 4. Use data to determine equilibrium concentrations. From the calibration curve prepared in Part A.5, use the recorded absorbance value for each test solution to determine the equilibrium molar concentration of FeNCS2+ 1. Data analysis. Complete the calculations as outlined on the Report Sheet and described in the Introduction. Complete an entire K, calculation for Test Solution 6 before attempting the calculations for the remaining solutions. Calculate the stan- dard deviation and relative standard deviation (RSD). Spectrophotometry is a powerful tool for analyzing substances that have color such as aspirin, transition metal ion complexes (Experiment 6), and anions (Experiment 3) to mention only a few. Research the spectrophotometric analysis of a specific substance and design a systematic study for its presence. C.10 Average K, C.11 Standard deviation of K C.12 Relative standard deviation of K, (RSD) Calculation for standard deviation. Class Data/Group Average K Calculate the standard deviation of K, from class data. 2 Calculate the relative standard deviation of K. (RSD) from class data. Appendix B Appendix B Laboratory Questions Circle the questions that have been assigned. 1. Part A.2. All spectrophotometers are different. The spectrophotometer is to be set at 447 nm. What experiment could you do, what data would you collect, and how would you analyze the data to ensure that 447 nm is the best setting for measuring the absorbance of FeNCS in this experiment? 2. Part A.3. In a hurry to complete the experiment, Joseph failed to calibrate the spectrophotometer. As a result, all absorbance values for the standard solutions that are measured and recorded are too high. How will this affect the fol- lowing for the Test Solutions in Parts B and C? a. Will the equilibrium concentrations of FeNCS² be too high, too low, or unaffected? Explain. b. Will the equilibrium concentrations of Fe" be too high, too low, or unaffected? Explain. c. Will the calculated equilibrium constants be too high, too low, or unaffected? Explain. 3. Part A.5. One of the standard solutions had an abnormally low absorbance reading, causing a less positive slope for the data plot. a. Will the equilibrium concentrations of FENCS²* in the Test Solutions (Part B) be too high or too low? Explain. b. Will the calculated K, for the equilibrium be too high, too low, or unaffected by the erred data plot? Explain. 4. Part B.3. Fingerprint smudges are present on the cuvet containing the solution placed into the spectrophotometer for analysis. a. How does this technique error affect the absorbance reading for FeNCS² in the analysis? Explain. b. Will the equilibrium concentration of FeNCS be recorded as being too high or too low? Explain. c. Will the equilibrium concentration of SCN be too high, too low, or unaffected by the technique error? Explain. d. Will the K, for the equilibrium be too high, too low, or unaffected by the technique error? Explain. 5. Part B.3. For the preparation of Test Solution 8 (Table 6.2), the 2.0 mL of 0.1 M HNO, is omitted. a. Will this technique error cause the absorbance reading for FeNCS² to be too high or too low? Explain. b. Will the K, for the equilibrium be too high, too low, or unaffected by the technique error? Explain. *6. The equation, A=abc (see footnote 1), becomes nonlinear at high concentrations of the absorbing substance. Suppose you prepare a solution with a very high absorbance that is suspect in not following the linear relationship. How might you still use the sample for your analysis rather than discarding the sample and the data? 100 An Equilibrium Constant tarat alations for K for K ERIMENTAL CEDURE of Standard as to Establish a tion Curve 166 160 Equilibrium Constant la Par B. precise vilumes of knows moter concentrations of Fe and SCN are mind The equilibrium molar concentration of FeNCS of the system is determined by measuring its absorbance and then using the calibration curve from Part A. Since Isolation is measured precisely, the initial moles of Fe and SCN and the equilibrium moles of FeNCS are easily calculated from known From equation 64, for every mole of FeNCS that exists at equilibrium, an equal her of exules of Fe" and SCN have reacted to reach equilibrium mol SCN mol FENCS mol Fe Therefore, the moles of Fe" at equilibrium (unreacted) is mol Fe mal Fe-mol Fe Similarly, the moles of SCN at equilibrium (unreacted) is mol SCN (68) Again, since the total volume of the reaction mixture is known precisely, the equilibrium molar concentrations of Fe and SCN (their equilibrium concentra- tions) can be calculated. Knowing the measured equilibrium molar concentration of FeNCS from the calibration curve, substitution of the three equilibrium molar com- centrations into the mass action expression provides the value of the equilibrium constant, K mol SCN-mol SCN (6.6) (6.7) The calculations for K, are involved, but completion of the Prelaboratory Assignment should clarify most of the steps. The Report Sheet is also outlined in such detail as to assist with the calculations. Procedure Overview: One set of solutions having known molar concentrations of FeNCS is prepared for a calibration curve, a plot of absorbance versus concentration. A second set of equilibrium solutions is prepared and mixed to determine the respec- tive equilibrium molar concentrations of FeNCS. By carefully measuring the initial amounts of reactants placed in the reaction systems and the absorbance, the mass action expression at equilibrium can be solved; this equals K. A large number of pipets and 100-mL volumetric flasks are used in this experi- ment. Ask your instructor about working with a partner. A spectrophotometer is an expensive, delicate analytical instrument. Operate it with care, following the advice of your instructor, and it will give you good data. The set of standard solutions is used to determine the absorbance of known molar con- centrations of FeNCS. A plot of the data, known as a calibration curve, is used to determine the equilibrium molar concentrations of FeNCS in Part B. Once the standard solutions are prepared, proceed smoothly and methodically through Part A.4. Therefore, read through all of Part A before proceeding. 1. Prepare a set of the standard solutions. Prepare the solutions in Table 6.1. Pipet 0,1,2,3,4 and 5 ml. of 0.001 M NaSCN into separate, labeled, and clean 25-ml volumetric flasks (or 200-mm test tubes). Pipet 10.0 ml. of 0.2 M Fe(NO₂), into each flask (or test tube) and quantitatively dilute to 25 ml. (the mark on the volu- metric flask) with 0.1 M HNO,. Stir or agitate each solution thoroughly to ensure that equilibrium is established. Table 6.1 Composition of the Set of Standard FeNCS Solutions for Preparing the Calibration Curve Standard 6.2 M FENO in 0.1 M HNOJ 10:00 1000 m. 10:00 1000 ml 100 ml 6.001 M NasiCN On 0.1 M HNO 4:00. 100 ml 4:00 100 w 6.1 MUNG, 25 16 d. 2500 Dato 2500 ml. Dato 25 10 v. "Record exact concentration as it appears on the reagent bottles. Record on the Report Sheet the exact molar concentrations of the Fe(NO) and NaSCN reagent solutions. 2. Prepare the blank solution. After the spectrophotometer has been turned on for 10 minutes and the wavelength scale has been set at 447 m, rinse a cuvet with several portions of the blank solution. Dry the outside of the cuvet with a clean Kimwipe, removing water and fingerprints Handle the lip of the cuvet thereafter. If a cuvet has two clear and two cloudy sides, be sure light passes through the clear sides and handle the cuvet on the cloudy sides. iiiiii 1 A set of labeled standard solutions 3. Calibrate the spectrophotometer. Fill the cuvet three-fourths filled with the blank solution. There are two types of spectrophotometers available in the lab. Ask your in structor which one you will use. If you use the UV Spectrophotometer Lambda XLS+ read Appendix H for instructions on calibration and use. If you use the Spec-20, fol low the procedure below to calibrate it. Place the cuvet into the sample compartment, align the mark on the cuvet with that on the sample holder, and close the cover. Set the meter on the spectrophotometer to read zero absorbance (or 100%7). Remove the cuvet. Consult with your instructor for any further calibration procedures. Once the instrument is set, do not perform any additional adjustments for the remainder of the experiment. If you accidentally do, merely repeat the calibration procedure. contains lighaberbing spaces except the one being invested 4. Record the absorbance of the standard solutions. Empty the cuvet and rinse it thoroughly with several small portions of solution 1. Fill it approximately three-fourths full. Again, carefully dry the outside of the cuvet with a clean Kimwipe. Remember, handle only the lip of the cuvet. Place the cuvet into the sam- ple compartment and align the cuvet and sample holder marks; read the absorbance (or percent transmittance if the spectrophotometer has a meter readout) and record. Repeat for solutions 2, 3, 4, and 5. Share the set of standard solutions with other chemists in the laboratory. 5. Graph the data. Plot absorbance, A (ordinate), versus [FeNCS] (abscissa) for the six solutions on linear graph paper or by using appropriate software. Draw the best straight line through the six points (see Figure 6.4) to establish the calibration curve. Ask your instructor to approve your graph. KimwipesEX-L A box of lintfree fissue Appendix C/D 1. Prepare the test solutions. In clean 150-mm test tubes (or 10-ml. volumetric flasks) prepare the test solutions in Table 6.2, page 94. Use pipets for the volumetric Water and fingerprints for any foreign material) on the outside of the cuvet reduce the intensity of the light transmitted to the detector. For spectrophotometers with a meter readout (as opposed to digitall, record the percent transmis tance and then calculate the absorbance Jequation 6.21. This procedure is more accurate because %T is a linear scale (whereas absorbance is logarithmic) and because it is easier to estimate the lin ear %T values more accurately and consistently 19⁰0 B. Absorbance for the Set of Test Solutions 166( If possible, prepare six matched cuvets, one for each standard solution, and successively measure the absorbance of each, remembering that the first solution is the blank solution. F 10-ml volumetric flasks are used, use pipets to dispense the volumes of the NaSCN and Fe(NO solutions and then dilute to the mark with 0.1 M HNO, 160 Experiment 6 93 ion ed test solutions Appendix B librium Constant Table 6.2 Composition of the Set of Equilibrium Test Solutions for the Determination of K Test 7 10 0.002 M Fe(NO₂ (in 0.1 M HNO₂) 500 ml 5.00 ml. 5.00 ml 500 ml 500 ml. 0.002 M NASCN (in 0.1 M HNO₂) 100 ml. 200 ml. 3,00 ml. 400 ml. 5.00 ml. Q.1 MHNO, 100 ml 2.00 ml. 100 mL measurements. Be careful not to mix pipets to avoid contamination of the reagents prior to the preparation. Also note that the molar concentration of Fe(NO), for this set of solutions is 0.002 M, not the 0.2 M solution used in Part A and the molar con- centration of NaSCN in 0.002 M, not 0.001 M. Record the exact molar concentrations of the Fe(NO,), and NaSCN reagent solutions on the Report Sheet. Once the test solutions are prepared, proceed smoothly and methodically (you need not hurry!) through Part B.3. 2. Recalibrate the spectrophotometer. Use the blank solution from Part A to check the calibration of the spectrophotometer. See Part A.3. Make sure you use the same spectrohotometer you used in Part A. 3. Determine the absorbance of the test solutions. Stir or agitate each test solution until equilibrium is reached (approximately 30 seconds). Rinse the cuvet thor- oughly with several portions of the test solution and fill it three-fourths full. Clean and dry the outside of the cuvet. Be cautious in handling the cuvets. Record the absorbance of each test solution as was done in Part A4. Disposal: Dispose of all waste thiocyanatoiron (III) ion solutions from Parts A and B in the Waste Salts container. CLEANUP: Rinse the volumetric flasks, the pipets, and the cuvets twice with tap water and twice with deionized water. Discard each rinse in the sink. 4. Use data to determine equilibrium concentrations. From the calibration curve prepared in Part A.5, use the recorded absorbance value for each test solution to determine the equilibrium molar concentration of FeNCS2+ 1. Data analysis. Complete the calculations as outlined on the Report Sheet and described in the Introduction. Complete an entire K, calculation for Test Solution 6 before attempting the calculations for the remaining solutions. Calculate the stan- dard deviation and relative standard deviation (RSD). Spectrophotometry is a powerful tool for analyzing substances that have color such as aspirin, transition metal ion complexes (Experiment 6), and anions (Experiment 3) to mention only a few. Research the spectrophotometric analysis of a specific substance and design a systematic study for its presence.
Expert Answer:
Answer rating: 100% (QA)
1 Part A2 To ensure that 447 nm is the best setting for measuring the absorbance of FeNCS in this experiment an experiment can be conducted to measure the absorbance of FeNCS at different wavelengths ... View the full answer

Related Book For 

Understandable Statistics Concepts And Methods
ISBN: 9780618986927
9th Edition
Authors: Charles Henry Brase, Corrinne Pellillo Brase
Posted Date:
Students also viewed these chemistry questions
-
Accounting need part 1 & part 2 answered End of lab Lab 1-1 Data Analytics in Financial Accounting Lets see how we might use financial accounting data to perform som
-
Fundamental questions for a survey research need to be answered at the design stage are: What sort of survey are you contemplating? What sort of respondent are you targeting? What questions do you...
-
Please answer the following questions related to the article provided and submit your paper to the assignment link. Please ensure that you list the article on your References page, and use in-text...
-
A vertical force P is applied to the ends of cord AB of length a and spring AC. If the spring has an unstretched length δ, determine the angle θ for equilibrium. Given: P = 10 lb δ...
-
Land appraised at $84,000 is purchased by issuing 1,000 shares of $10 par value common stock. The market price of the shares at the time of the exchange, based on active trading in the securities...
-
A rocket in deep space has an exhaust-gas speed of 2000 m/s. When the rocket is fully loaded, the mass of the fuel is five times the mass of the empty rocket. What is the rockets speed when half the...
-
What prefiling requirements should be considered?
-
The accountant for Healthy Medical Co., a medical services consulting firm, mistakenly omitted adjusting entries for (a) Unearned revenue earned during the year ($175,000) (b) Accrued wages...
-
1. Explain how organizations can create team players. 2. What is social loafing? How can the management undermine the tendency of social loafing? 3. Distinguish between high-context and low-context...
-
Planning is one of the most important management functions in any business. A front office managers first step in planning should involve determine the departments goals. Planning also includes...
-
Each summary should include a descriptive and evaluative paragraph on the following attributes: Include the origins of the model (who developed it, when was it developed, and the context under which...
-
Consider the following items for Shocker Enterprises: 1. On November 30, 2024, Shocker received a $4,500 payment from a customer for services to be rendered evenly over the next three months....
-
Our financial projections assume that S'Naps will be in operation at the beginning of Year 1. We estimate that we will capture 1% of our target market (international and domestic business/leisure...
-
Each of the following independent events requires a year - end adjusting entry. Paid $ 4 8 , 0 0 0 cash in advance on July 1 for a one - year lease on office space. Purchased $ 5 , 0 0 0 of supplies...
-
An exponential model y=ae bx is fitted to the data. The parameters have been obtained a=2.677551 b=3.42324. To facilitate further calculations, the parameters are rounded to one decimal place. How...
-
A very long thin wire carries a linear charge density of 2 . 3 3 x 1 0 - 5 C / m . Determine the electric field magnitude at a distance of 1 6 . 7 cm from the middle of the length of wire. ( K = 1 /...
-
The proposed techniques for leading an educational organization to fully integrate collaboration, coaching, and mentoring into its culture include the following:. When discussing, will you please...
-
Could a set of three vectors in span all of? Explain. What about n vectors in when n is less than m? R4
-
About 11% of Americans believe that Joan of Arc was Noahs wife. (Source: Harpers Index, Volume 3.) At a large freshman symposium, a college professor (jokingly) says that Joan of Arc was Noahs wife....
-
Examine Figure 2-21, Global Teen Worries. How many countries were contained in the sample? The graph contains bars and a circle. Which bar is the longest? Which bar represents the greatest...
-
Discuss each of the following topics in class or review the topics on your own. Then write a brief but complete essay in which you summarize the main points. Please include formulas and graphs as...
-
A Laplacian operator is given by a. \(\frac{\partial^{2}}{\partial x \partial y}\) b. \(\frac{\partial^{2}}{\partial x^{2}}+\frac{\partial^{2}}{\partial y^{2}}+2 \frac{\partial^{2}}{\partial x...
-
A cable of length \(l\) and mass \(ho\) per unit length is stretched under a tension \(P\). One end of the cable is connected to a mass \(m\), which can move in a frictionless slot, and the other end...
-
Fill in the Blank. The quantities \(E I\) and \(G J\) are called the ___________ and ____________ stiffnesses, respectively.

Study smarter with the SolutionInn App