

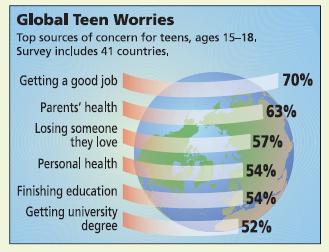
Examine Figure 2-21, Global Teen Worries. How many countries were contained in the sample? The graph contains
Question:
Examine Figure 2-21, “Global Teen Worries.” How many countries were contained in the sample? The graph contains bars and a circle. Which bar is the longest? Which bar represents the greatest percentage? Is this a bar graph or not? If not, what changes would need to be made to put the information into a bar graph? Could the graph be made into a Pareto chart? Could it be made into a circle graph? Explain.
Fantastic news! We've Found the answer you've been seeking!
Step by Step Answer:
41 nations were represented in the sample according to the graph The worry bar for getting a uni...View the full answer

Answered By
Akash M Rathod
I have been utilized by educators and students alike to provide individualized assistance with everything from grammar and vocabulary to complex problem-solving in various academic subjects. I can provide explanations, examples, and practice exercises tailored to each student's individual needs, helping them to grasp difficult concepts and improve their skills.
My tutoring sessions are interactive and engaging, utilizing a variety of tools and resources to keep learners motivated and focused. Whether a student needs help with homework, test preparation, or simply wants to improve their skills in a particular subject area, I am equipped to provide the support and guidance they need to succeed.
0 Reviews
10+ Question Solved
Related Book For 
Understandable Statistics Concepts And Methods
ISBN: 9780618986927
9th Edition
Authors: Charles Henry Brase, Corrinne Pellillo Brase
Question Posted:
