

Question: Last year, five randomly selected business students took a statistics aptitude test before they began their business course. In the table below, the x column
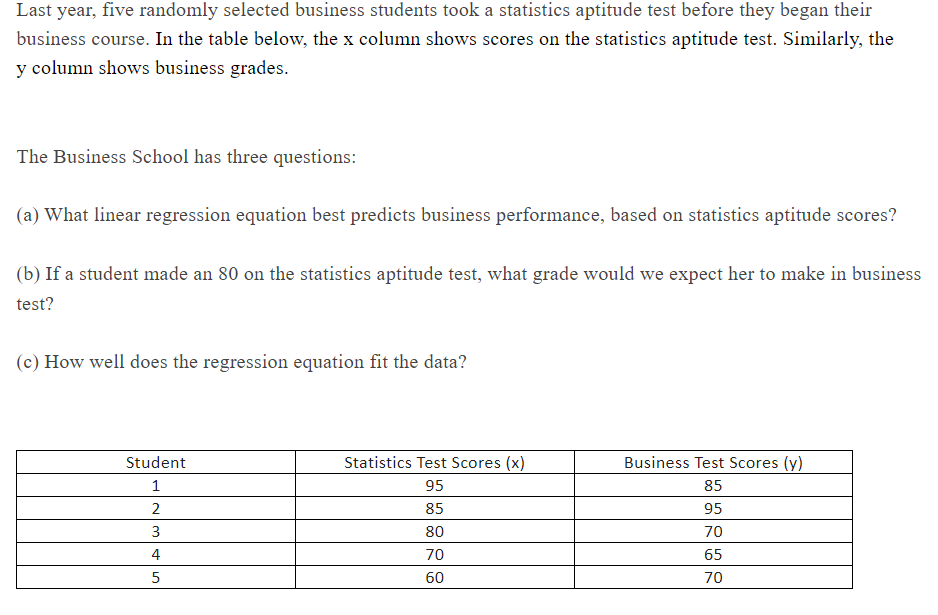
Last year, five randomly selected business students took a statistics aptitude test before they began their
business course. In the table below, the column shows scores on the statistics aptitude test. Similarly, the
y column shows business grades.
The Business School has three questions:
a What linear regression equation best predicts business performance, based on statistics aptitude scores?
b If a student made an on the statistics aptitude test, what grade would we expect her to make in business
test?
c How well does the regression equation fit the data?
Step by Step Solution
There are 3 Steps involved in it
1 Expert Approved Answer
Step: 1 Unlock

Question Has Been Solved by an Expert!
Get step-by-step solutions from verified subject matter experts
Step: 2 Unlock
Step: 3 Unlock