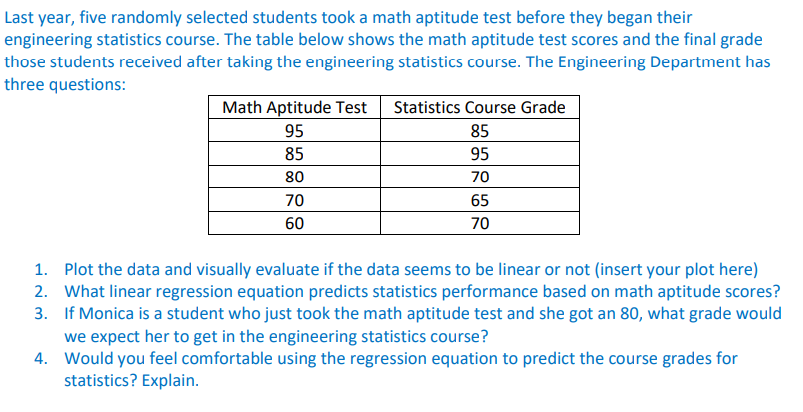
Question: Last year, five randomly selected students took a math aptitude test before they began their engineering statistics course. The table below shows the math aptitude

Last year, five randomly selected students took a

Last year, five randomly selected students took a math aptitude test before they began their engineering statistics course. The table below shows the math aptitude test scores and the final grade those students received after taking the engineering statistics course. The Engineering Department has three questions: 1. Plot the data and visually evaluate if the data seems to be linear or not (insert your plot here) 2. What linear regression equation predicts statistics performance based on math aptitude scores? 3. If Monica is a student who just took the math aptitude test and she got an 80 , what grade would we expect her to get in the engineering statistics course? 4. Would you feel comfortable using the regression equation to predict the course grades for statistics? Explain

Step by Step Solution

There are 3 Steps involved in it

1 Expert Approved Answer
Step: 1 Unlock blur-text-image
Question Has Been Solved by an Expert!

Get step-by-step solutions from verified subject matter experts

Step: 2 Unlock
Step: 3 Unlock

Students Have Also Explored These Related General Management Questions!