

Question: Lead Identification and Optimization In a certain drug discovery project it is of interest to find a peptide that binds well to a specific virus
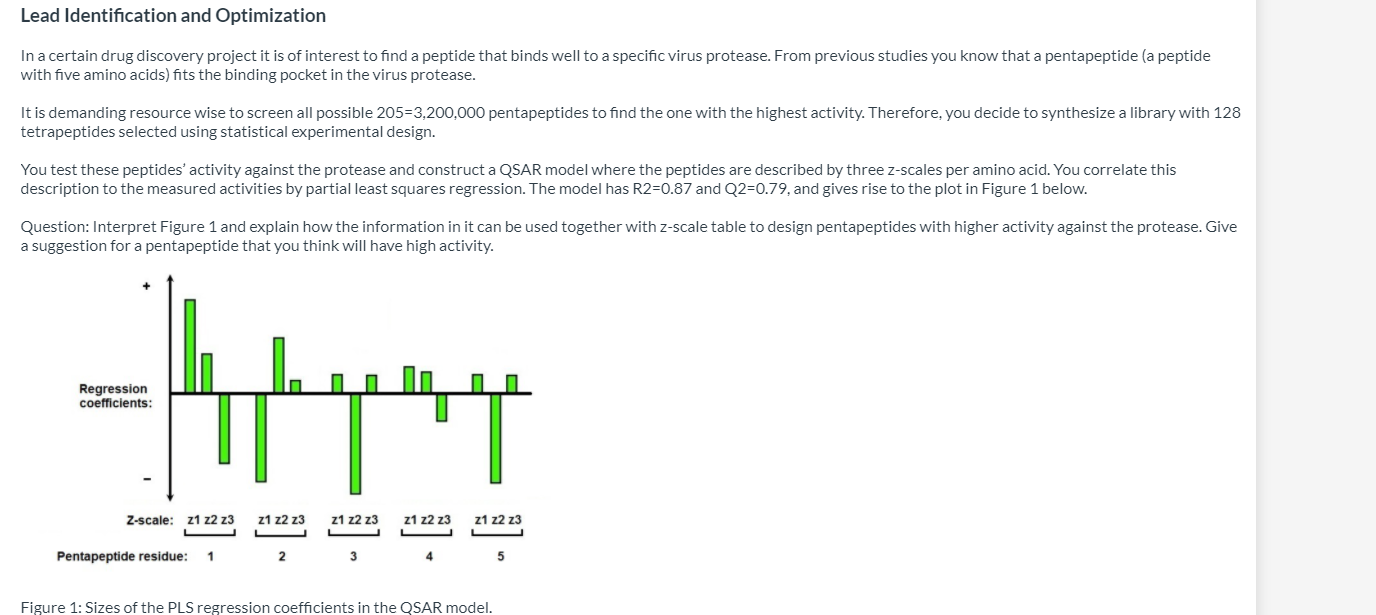
Lead Identification and Optimization In a certain drug discovery project it is of interest to find a peptide that binds well to a specific virus protease. From previous studies you know that a pentapeptide (a peptide with five amino acids) fits the binding pocket in the virus protease. It is demanding resource wise to screen all possible 205-3,200,000 pentapeptides to find the one with the highest activity. Therefore, you decide to synthesize a library with 128 tetrapeptides selected using statistical experimental design. You test these peptides' activity against the protease and construct a QSAR model where the peptides are described by three z-scales per amino acid. You correlate this description to the measured activities by partial least squares regression. The model has R2=0.87 and Q2=0.79, and gives rise to the plot in Figure 1 below. Question: Interpret Figure 1 and explain how the information in it can be used together with Z-scale table to design pentapeptides with higher activity against the protease. Give a suggestion for a pentapeptide that you think will have high activity. Regression coefficients: Z-scale: 21 22 23 21 22 23 21 22 23 21 22 23 z1 22 23 Pentapeptide residue: 1 3 Figure 1: Sizes of the PLS regression coefficients in the QSAR model. Lead Identification and Optimization In a certain drug discovery project it is of interest to find a peptide that binds well to a specific virus protease. From previous studies you know that a pentapeptide (a peptide with five amino acids) fits the binding pocket in the virus protease. It is demanding resource wise to screen all possible 205-3,200,000 pentapeptides to find the one with the highest activity. Therefore, you decide to synthesize a library with 128 tetrapeptides selected using statistical experimental design. You test these peptides' activity against the protease and construct a QSAR model where the peptides are described by three z-scales per amino acid. You correlate this description to the measured activities by partial least squares regression. The model has R2=0.87 and Q2=0.79, and gives rise to the plot in Figure 1 below. Question: Interpret Figure 1 and explain how the information in it can be used together with Z-scale table to design pentapeptides with higher activity against the protease. Give a suggestion for a pentapeptide that you think will have high activity. Regression coefficients: Z-scale: 21 22 23 21 22 23 21 22 23 21 22 23 z1 22 23 Pentapeptide residue: 1 3 Figure 1: Sizes of the PLS regression coefficients in the QSAR model
Step by Step Solution
There are 3 Steps involved in it

Get step-by-step solutions from verified subject matter experts