

Question: Learning objective: This project is designed for you to compute contribution margin, and conduct break- even and what if analyses by using Excel spreadsheets. Requirements:
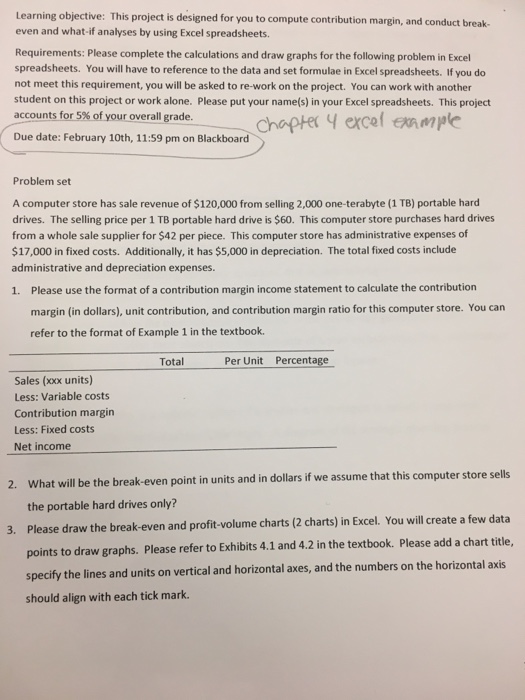

Learning objective: This project is designed for you to compute contribution margin, and conduct break- even and what if analyses by using Excel spreadsheets. Requirements: Please complete the calculations and draw graphs for the following problem in Excel spreadsheets. You will have to reference to the data and set formulae in Excel spreadsheets. If you do not meet this requirement, you will be asked to re-work on the project. You can work with another student on this project or work alone. Please put your name(s) in your Excel spreadsheets. This project accounts for 5% of your overall grade. chapter excel enmple Due date: February 10th, 11:59 pm on Blackboard Problem set A computer store has sale revenue of $120,000 from selling 2,000 one-terabyte (1 TB) portable hard drives. The selling price per 1TB portable hard drive is $60. This computer store purchases hard drives from a whole sale supplier for S42 per piece. This computer store has administrative expenses of $17,000 in fixed costs. Additionally, it has $5,000 in depreciation. The total fixed costs include administrative and depreciation expenses. 1. Please use the format of a contribution margin income statement to calculate the contribution margin (in dollars), unit contribution, and contribution margin ratio for this computer store. You can refer to the format of Example 1 in the textbook. Total Per Unit Percentage Sales (xxx units) Less: Variable costs Contribution margin Less: Fixed costs. Net income 2. What will the break-even point in units and in dollars if we assume that this computer store sells be the portable hard drives only? 3. Please draw the break-even and profit-volume charts (2 harts) in Excel. You will create a few data points to draw graphs. Please refer to Exhibits 4.1 and 4.2 in the textbook. Please add a chart title a specify the lines and units on vertical and horizontal axes, and the numbers on the horizontal axis should align with each tick mark
Step by Step Solution
There are 3 Steps involved in it

Get step-by-step solutions from verified subject matter experts