

Question: Learning Task 2. Graphing Directions: Study the figures below. Plot the volume, pressure and temperature on each of the graphs. Connect the plotted points and
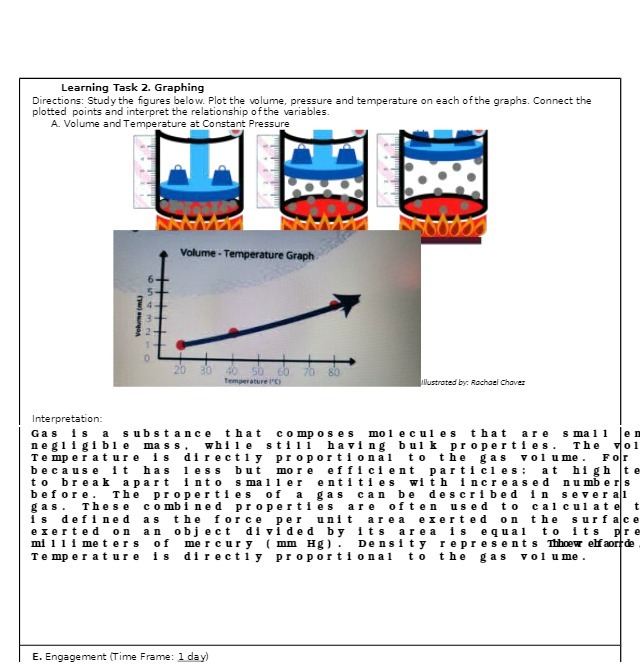
Learning Task 2. Graphing Directions: Study the figures below. Plot the volume, pressure and temperature on each of the graphs. Connect the plotted points and interpret the relationship of the variables. A. Volume and Temperature at Constant Pressure Volume - Temperature Graph 20 30 40 50 60 Temperature i'C) Illustrated by: Rachael Chavez Interpretation: Gas is a substance that composes molecules that are small e negligible mass . while still having bulk properties. The vol Temperature 18 directly proportional to the gas volume. For because it has less but more efficient particles: at high It to break apart into smaller entities with increased numbers before. The properties of a gas can De described in several gas. These combined properties are often used to calculate is defined the force per unit area exerted on the surface exerted o object divided by its area 1s equal to its pre millimeters mercury ( mm Hg) . Density represents Thoew elfoortde Temperature directly proportional to the volume . E. Engagement (Time Frame: 1 day)
Step by Step Solution
There are 3 Steps involved in it

Get step-by-step solutions from verified subject matter experts