

Question: {Lemme}? .,.. .___._..._..._...'~ late To keep up'todate with security updates, fixes, and improvement... I consider the network described by the table below. Activity Predeeessors Durationtdnys)
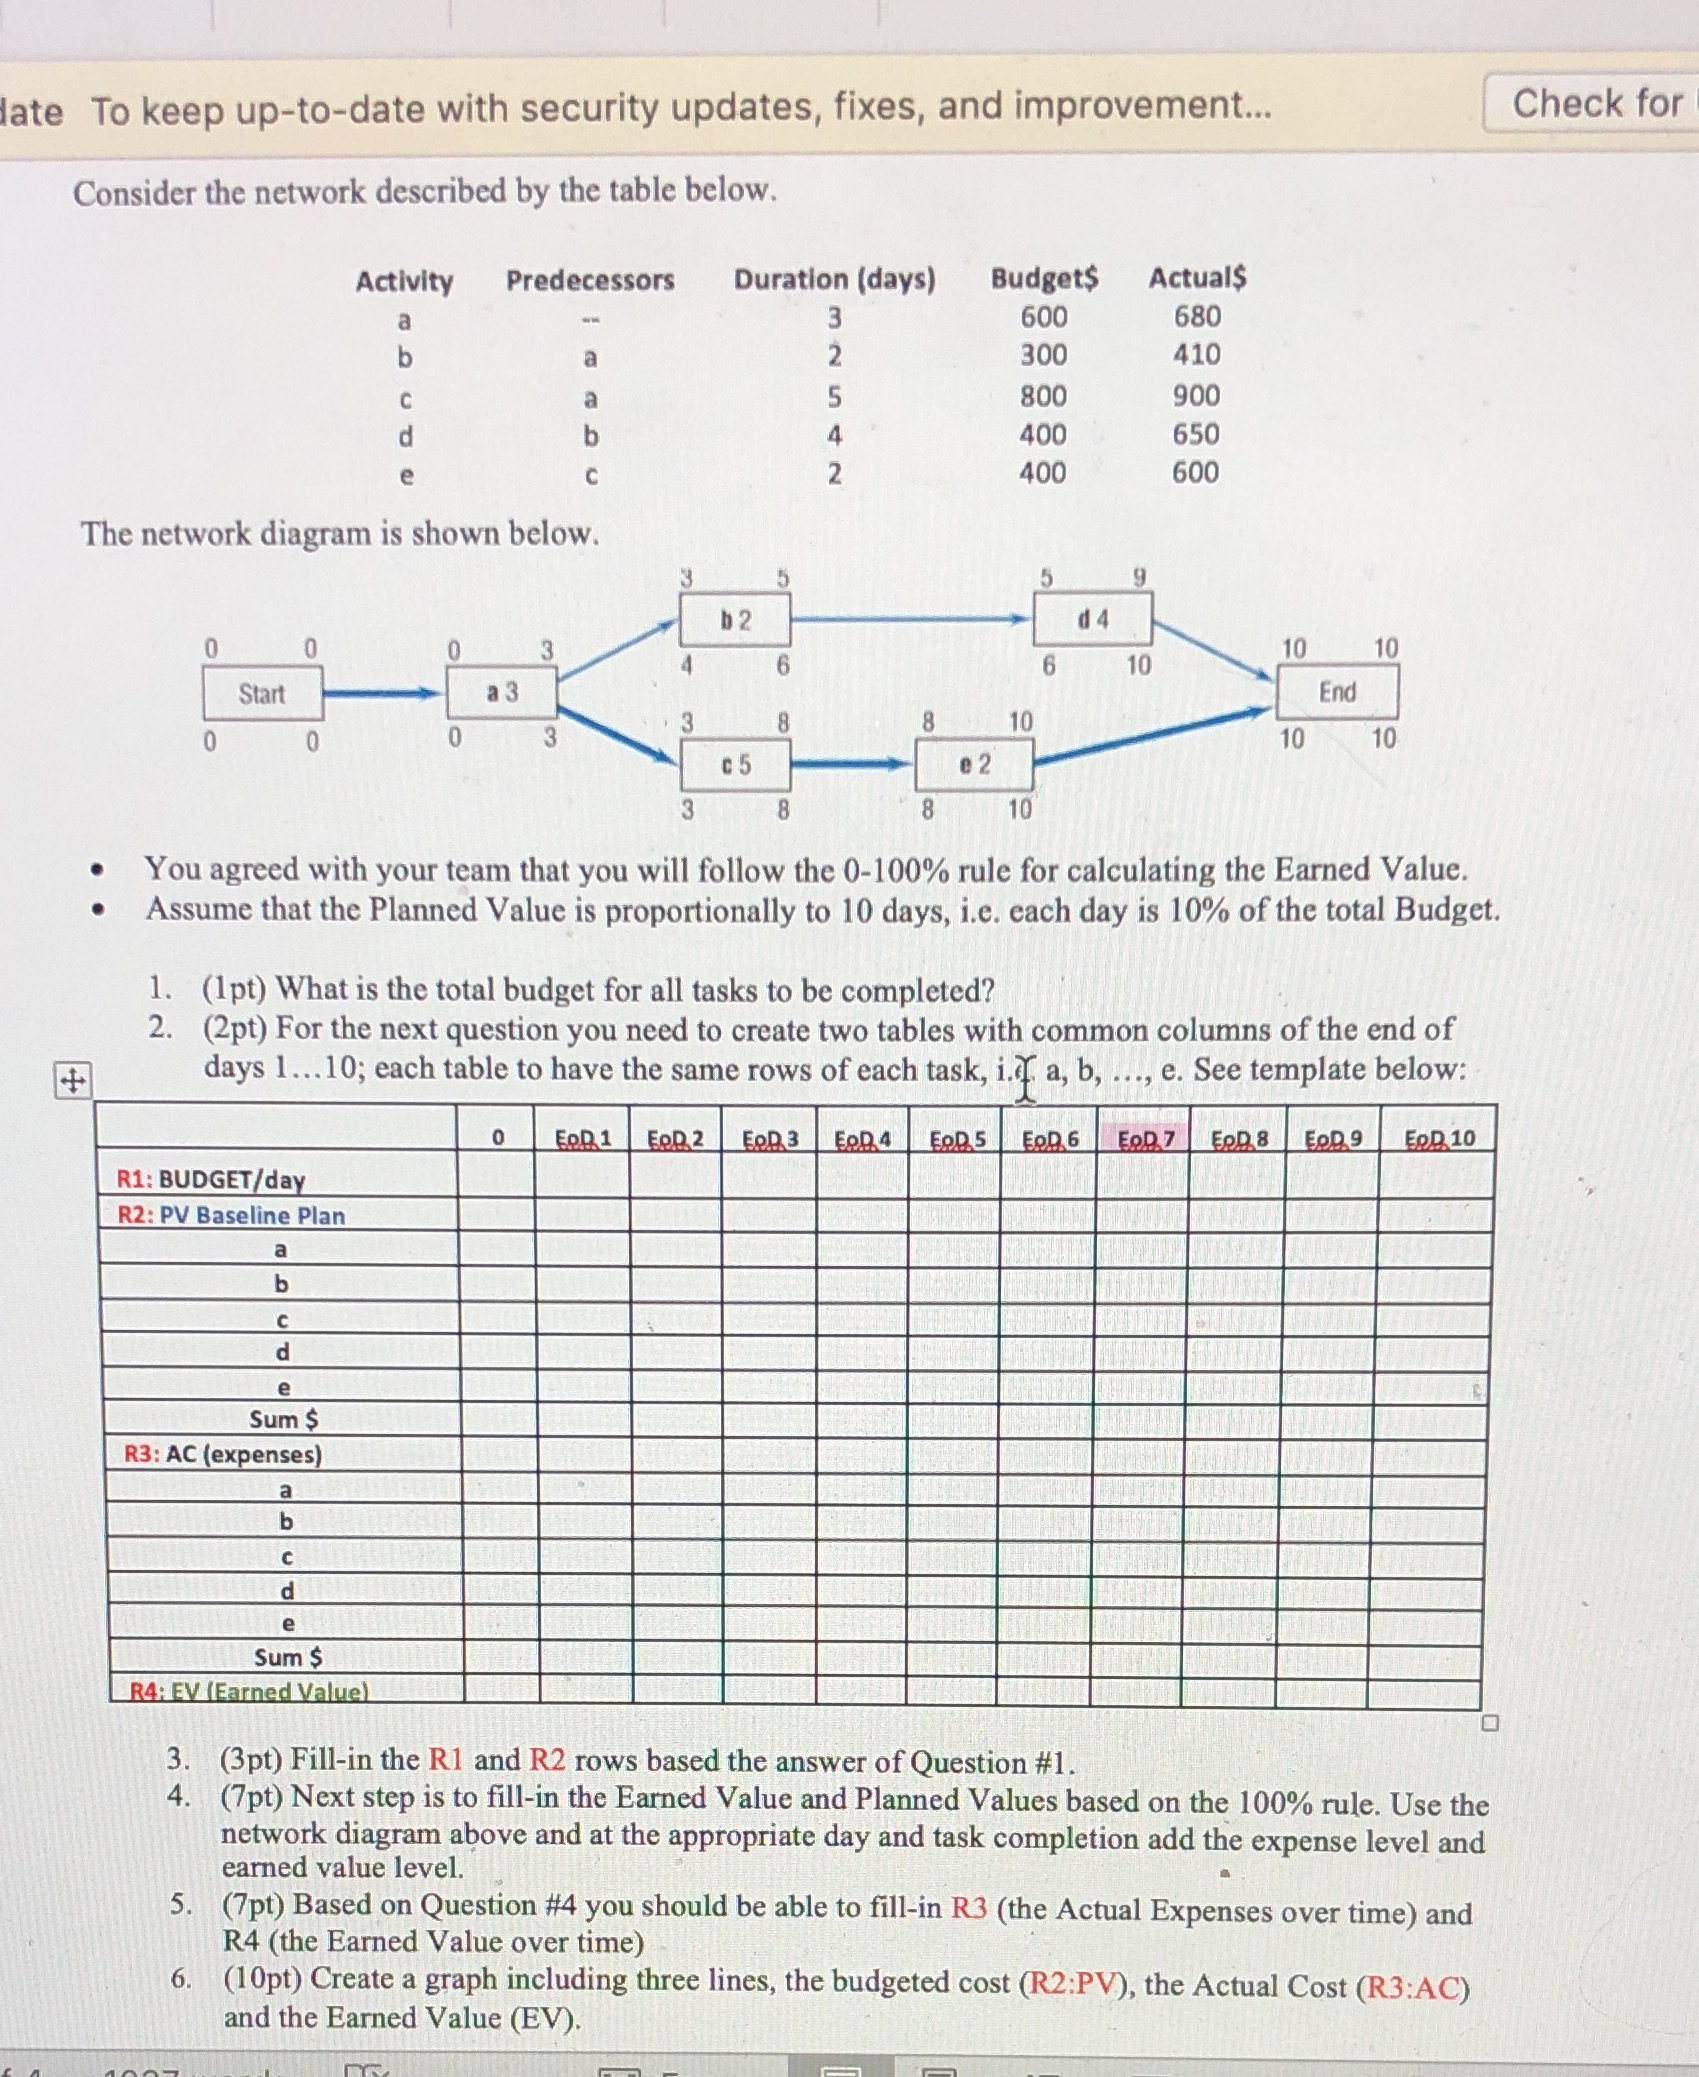
{Lemme}? .,.. .___._..._..._...'~ late To keep up'todate with security updates, fixes, and improvement... I consider the network described by the table below. Activity Predeeessors Durationtdnys) Budnt$ Actuals a -- 3 600 680 b a 2 300 410 t: I 5 300 900 d b 1i 400 650 e c 2 400 600 The network diagmm is shown below. IO 10 10 10 3 8 8 10 You agreed with your team that you will follow the 0-100% rule for calculating the Earned Value. 0 Assume that the Planned Value is proportionally to 1.0 days, i.e. each day is 10% of the total Budget. 1. (lot) What is the total budget for all tasks to be completed? I. 2. (2pt) For the next question you need to create two tables with common columns of the end of days l...10; each table to have the same rows of each task, i.c . a, b, ..., e. See template below: -_----------- _--------- ,3 (3m) Fill-in the R1 and 32 rows based the answers? Question #1. - (713's) Next step is to llin the Earned Value and Planned Values based on the 100% rule. Use the network diagram above and at the appropriate day and task completion add the expense level and earned value level. " ' . ' 5.. (7pt) Based on Question #4 you should be able to fillwin R3 (the Actual Expenses over time) and . R4 (the Earned Value over time) ' , ' ' . ' 6. (1 Opt) Create a graph including three lines, the budgeted cost (R2:PV). the Actual Cost (R3:AC) I and the Flamed Value (EV). . H
Step by Step Solution
There are 3 Steps involved in it

Get step-by-step solutions from verified subject matter experts