

Question: Let b = 1 , and graph C = a t e - b t using different values for a . Explain the effect of
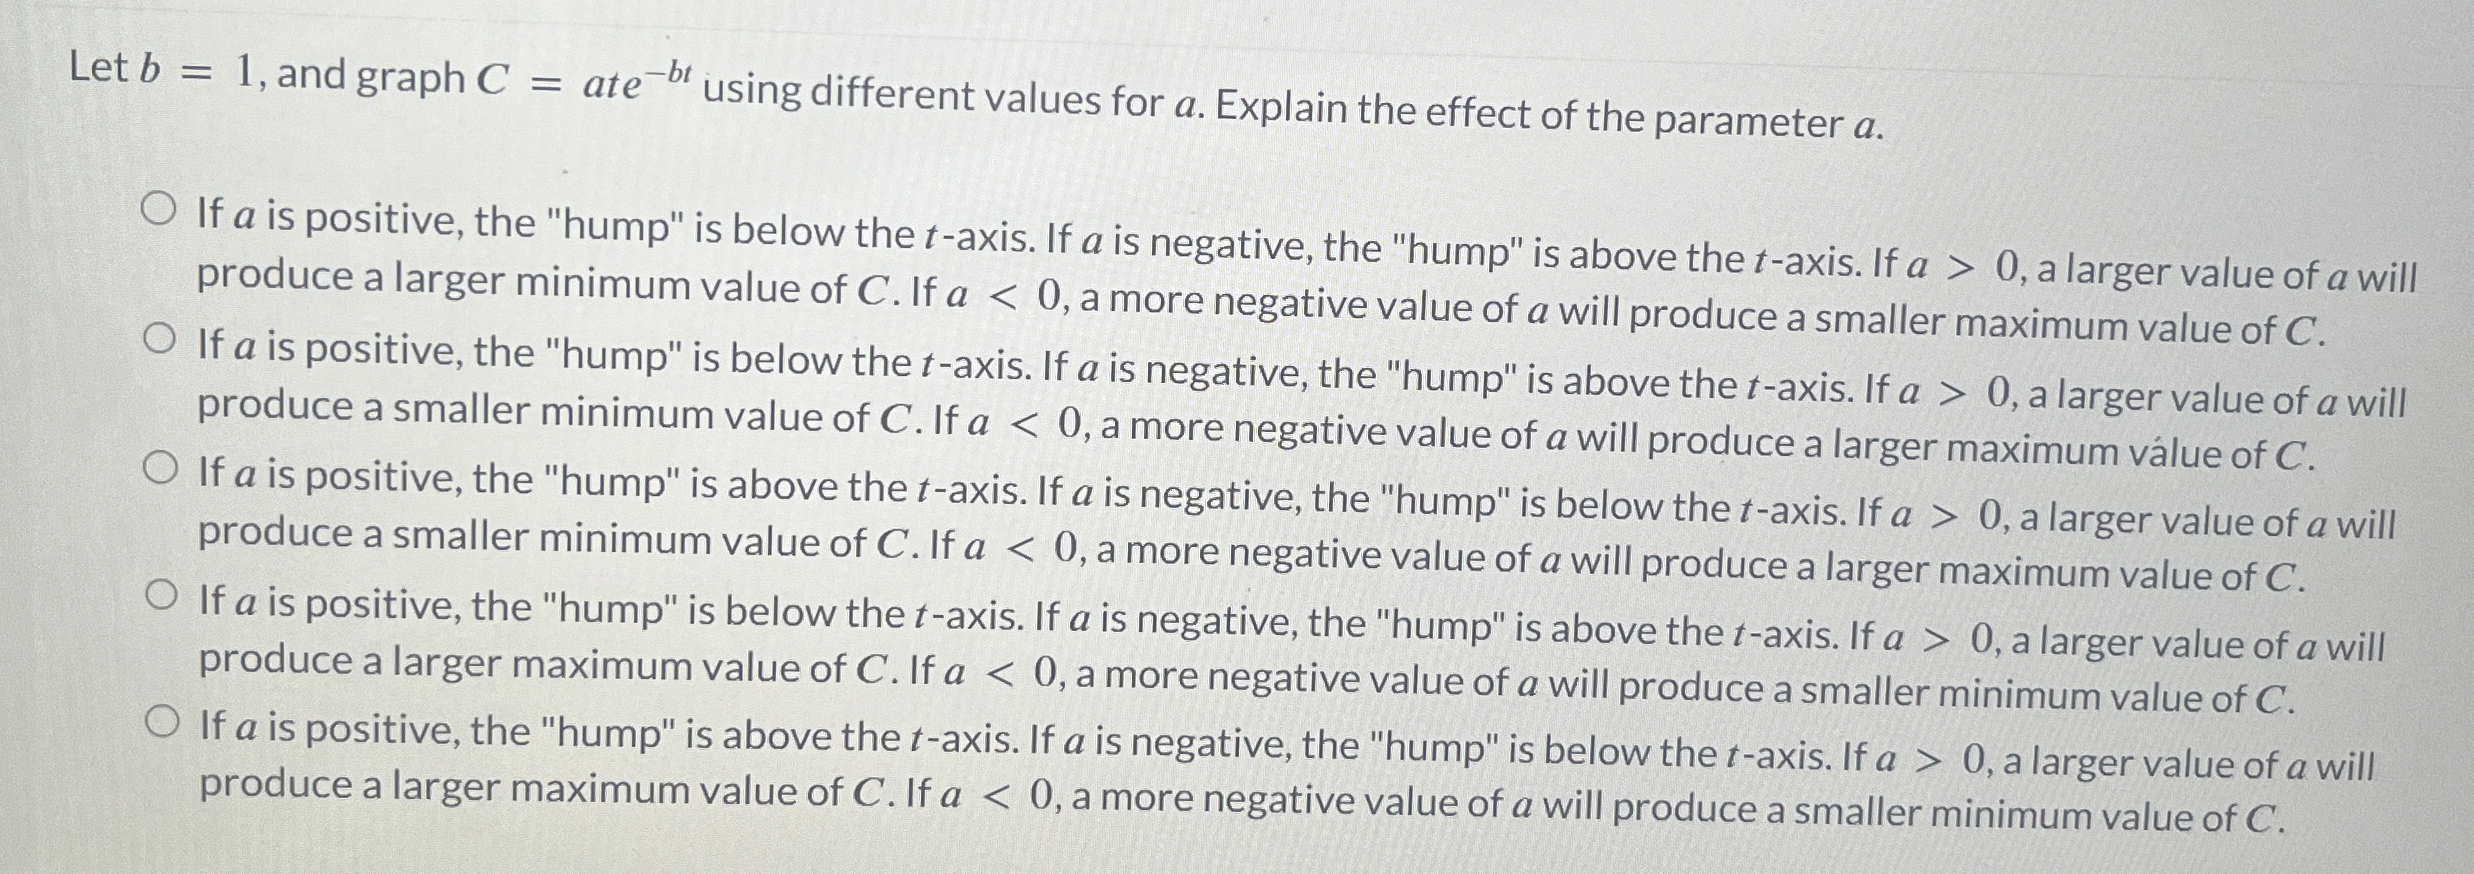
Let and graph using different values for Explain the effect of the parameter
If is positive, the "hump" is below the axis. If is negative, the "hump" is above the axis. If a larger value of a will produce a larger minimum value of If a more negative value of a will produce a smaller maximum value of
If is positive, the "hump" is below the axis. If is negative, the "hump" is above the axis. If a larger value of a will produce a smaller minimum value of If a more negative value of a will produce a larger maximum vallue of
If is positive, the "hump" is above the axis. If is negative, the "hump" is below the axis. If a larger value of a will produce a smaller minimum value of If a more negative value of a will produce a larger maximum value of
If is positive, the "hump" is below the axis. If is negative, the "hump" is above the axis. If a larger value of a will produce a larger maximum value of If a more negative value of a will produce a smaller minimum value of
If is positive, the "hump" is above the axis. If is negative, the "hump" is below the axis. If a larger value of a will produce a larger maximum value of If a more negative value of a will produce a smaller minimum value of
Step by Step Solution
There are 3 Steps involved in it
1 Expert Approved Answer
Step: 1 Unlock

Question Has Been Solved by an Expert!
Get step-by-step solutions from verified subject matter experts
Step: 2 Unlock
Step: 3 Unlock