

Question: Let f(u,) be the probability density function of a normally distributed random variable in R. Write code to plot the isocontours of the following
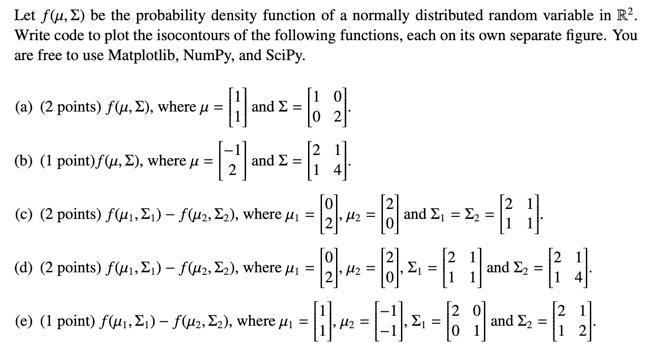
Let f(u,) be the probability density function of a normally distributed random variable in R. Write code to plot the isocontours of the following functions, each on its own separate figure. You are free to use Matplotlib, NumPy, and SciPy. [1 (a) (2 points) f(u,E), where, and = = 10 2 - (b) (1 point)f(u, ), where = and (c) (2 points) f(u,)f(2, 2), where = and = = }} }} (d) (2 points) f(1,1)f(2, 2), where = M2 = = and = 14 (e) (1 point) f(1,1) f(2,2), where = H2= = and 2=
Step by Step Solution
There are 3 Steps involved in it
1 Expert Approved Answer
Step: 1 Unlock

Question Has Been Solved by an Expert!
Get step-by-step solutions from verified subject matter experts
Step: 2 Unlock
Step: 3 Unlock