

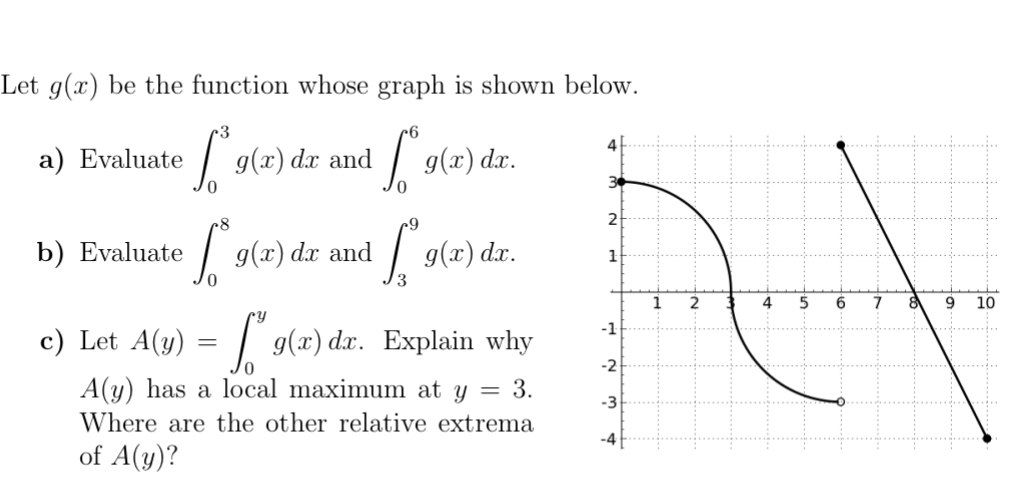
Question: Let g ( x ) be the function whose graph is shown below. a ) Evaluate 0 3 g ( x ) d x and
Let be the function whose graph is shown below.
a Evaluate and
b Evaluate and
c Let Explain why has a local maximum at Where are the other relative extrema of
Step by Step Solution
There are 3 Steps involved in it
1 Expert Approved Answer
Step: 1 Unlock

Question Has Been Solved by an Expert!
Get step-by-step solutions from verified subject matter experts
Step: 2 Unlock
Step: 3 Unlock