

Question: Let n1 = 80, X1 = 10, n2 = 80, and X, = 30. Complete parts (a) and (b) below. a. At the 0.10 level
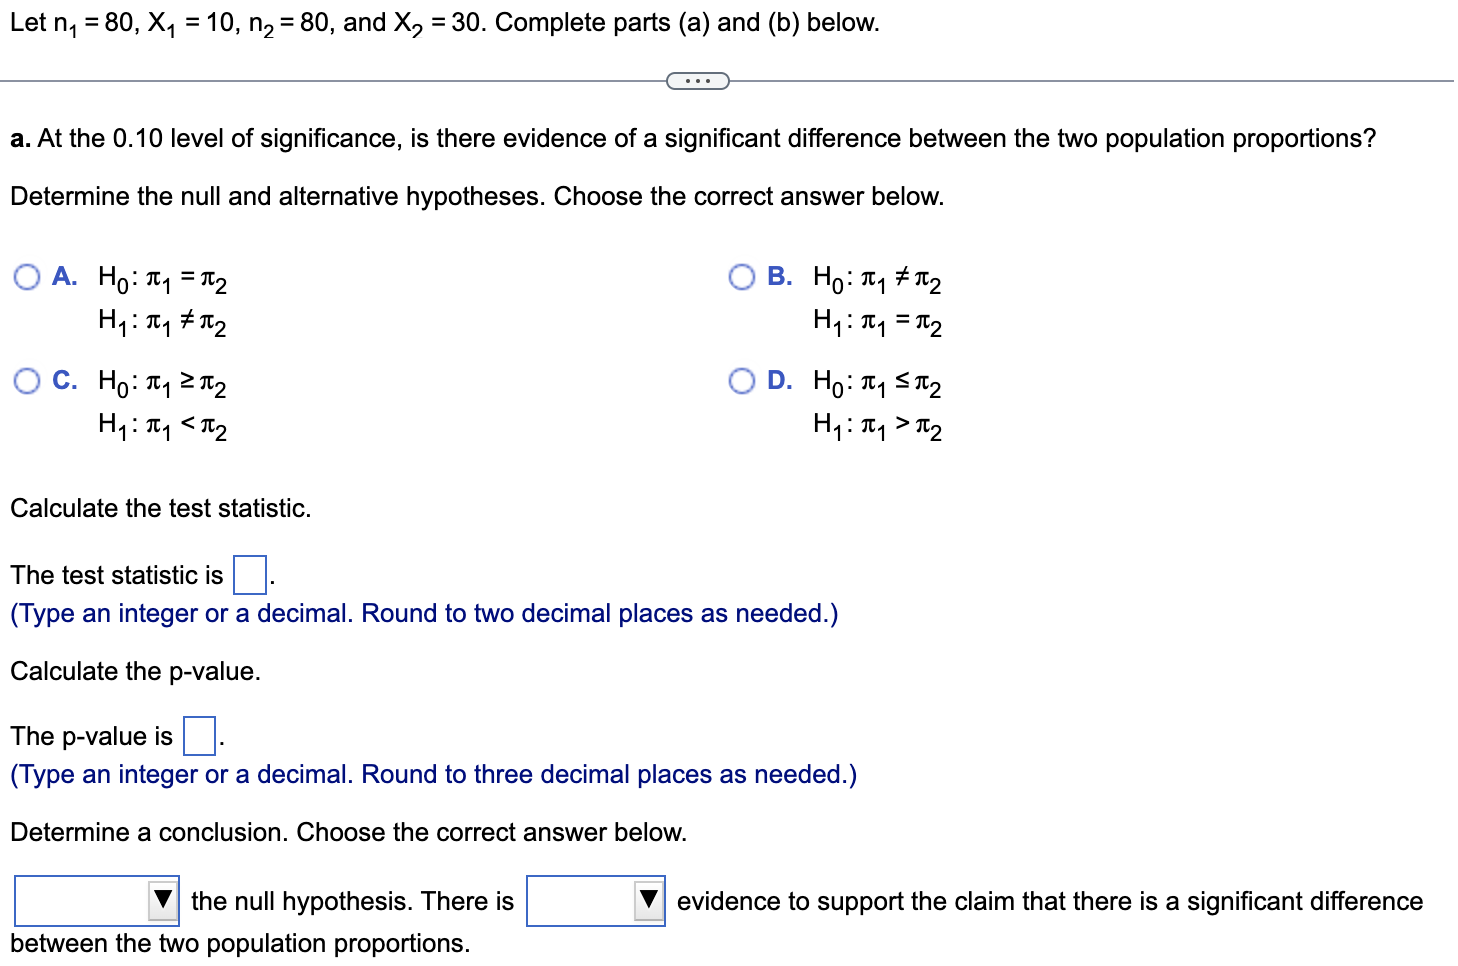

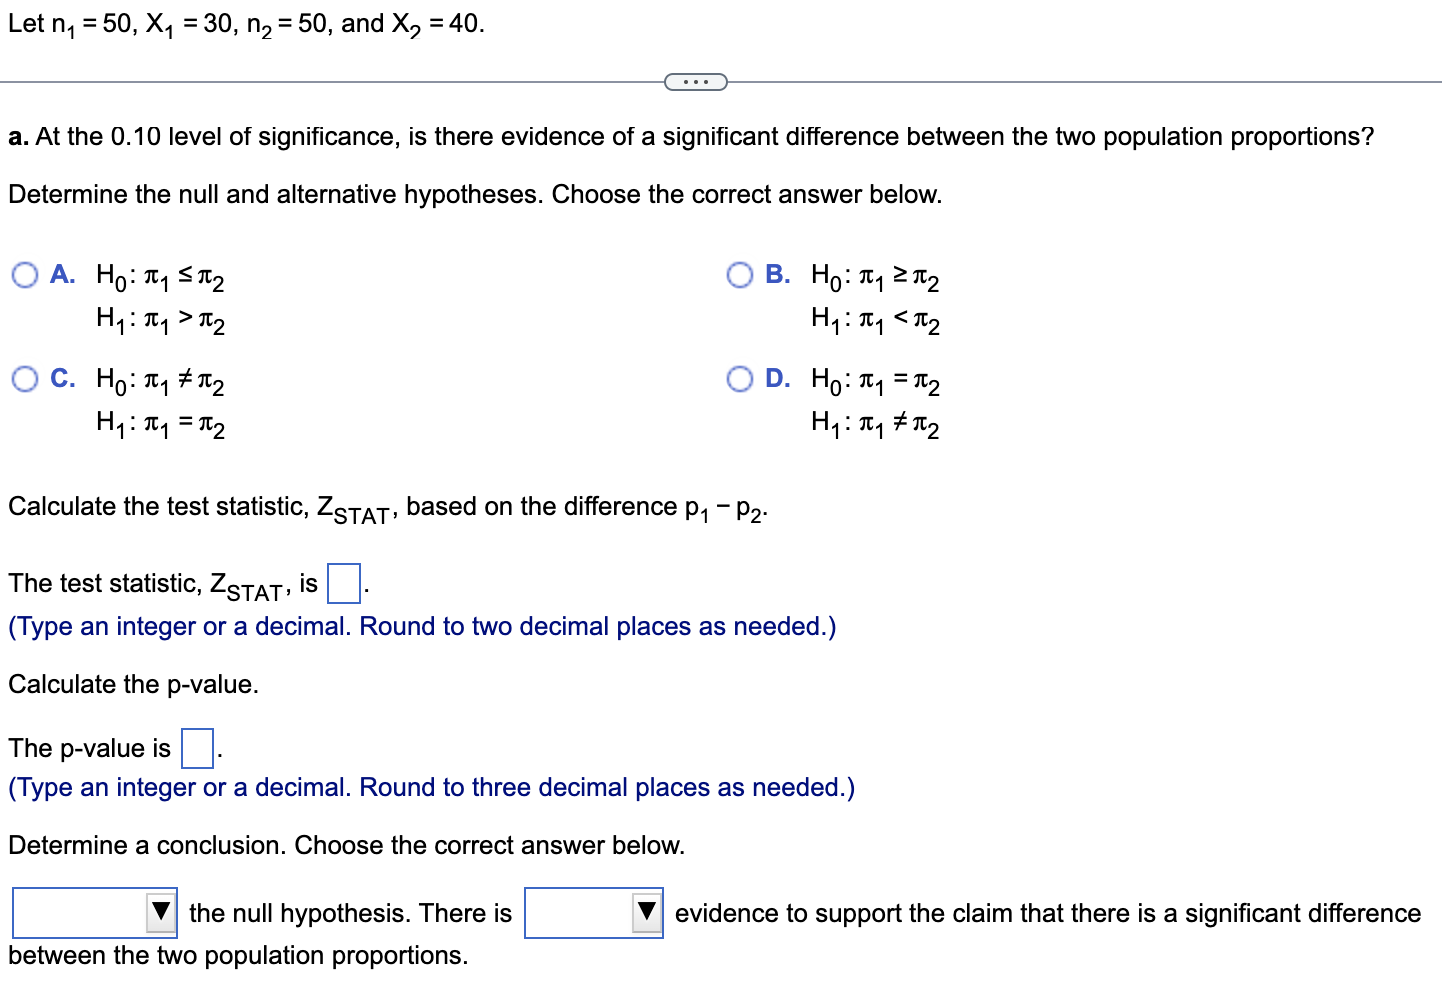
Let n1 = 80, X1 = 10, n2 = 80, and X, = 30. Complete parts (a) and (b) below. <:> a. At the 0.10 level of signicance, is there evidence of a signicant difference between the two population proportions? Determine the null and alternative hypotheses. Choose the correct answer below. 0 A. HO: 11:1 =E2 O B. Ho:n11T-2 H1:n17c2 H1:n1=ir2 O C. HO:II:121c2 O D. Ho:it151r.2 H1:Tl:13t2 Calculate the test statistic. The test statistic is E. (Type an integer or a decimal. Round to two decimal places as needed.) Calculate the p-value. The p-value is E. (Type an integer or a decimal. Round to three decimal places as needed.) Determine a conclusion. Choose the correct answer below. |:l the null hypothesis. There is |:l evidence to support the claim that there is a signicant difference between the two population proportions. Let n, = 80, X1 = 40, n2 = 80, and X, = 60. Complete parts (a) and (b) below. a. At the 0.05 level of significance, is there evidence of a significant difference between the two population proportions? Determine the null and alternative hypotheses. Choose the correct answer below. O A. HO: T1 = 12 OB. HO: T1 # 1 2 Hy : my # 1 2 Hy : I1 = 2 OC. HO: T1 ST 2 OD. HO: T1 2 1 2 H1 : 1 1 > I 2 Hy : my I2 H1:1
Step by Step Solution
There are 3 Steps involved in it

Get step-by-step solutions from verified subject matter experts