

Question: Let's consider data from soft tissue mechanical testing ( Given below ) . Complete the following curve fitting tasks using PYTHON code. import numpy as
Let's consider data from soft tissue mechanical testing Given below Complete the following curve fitting tasks using PYTHON code.
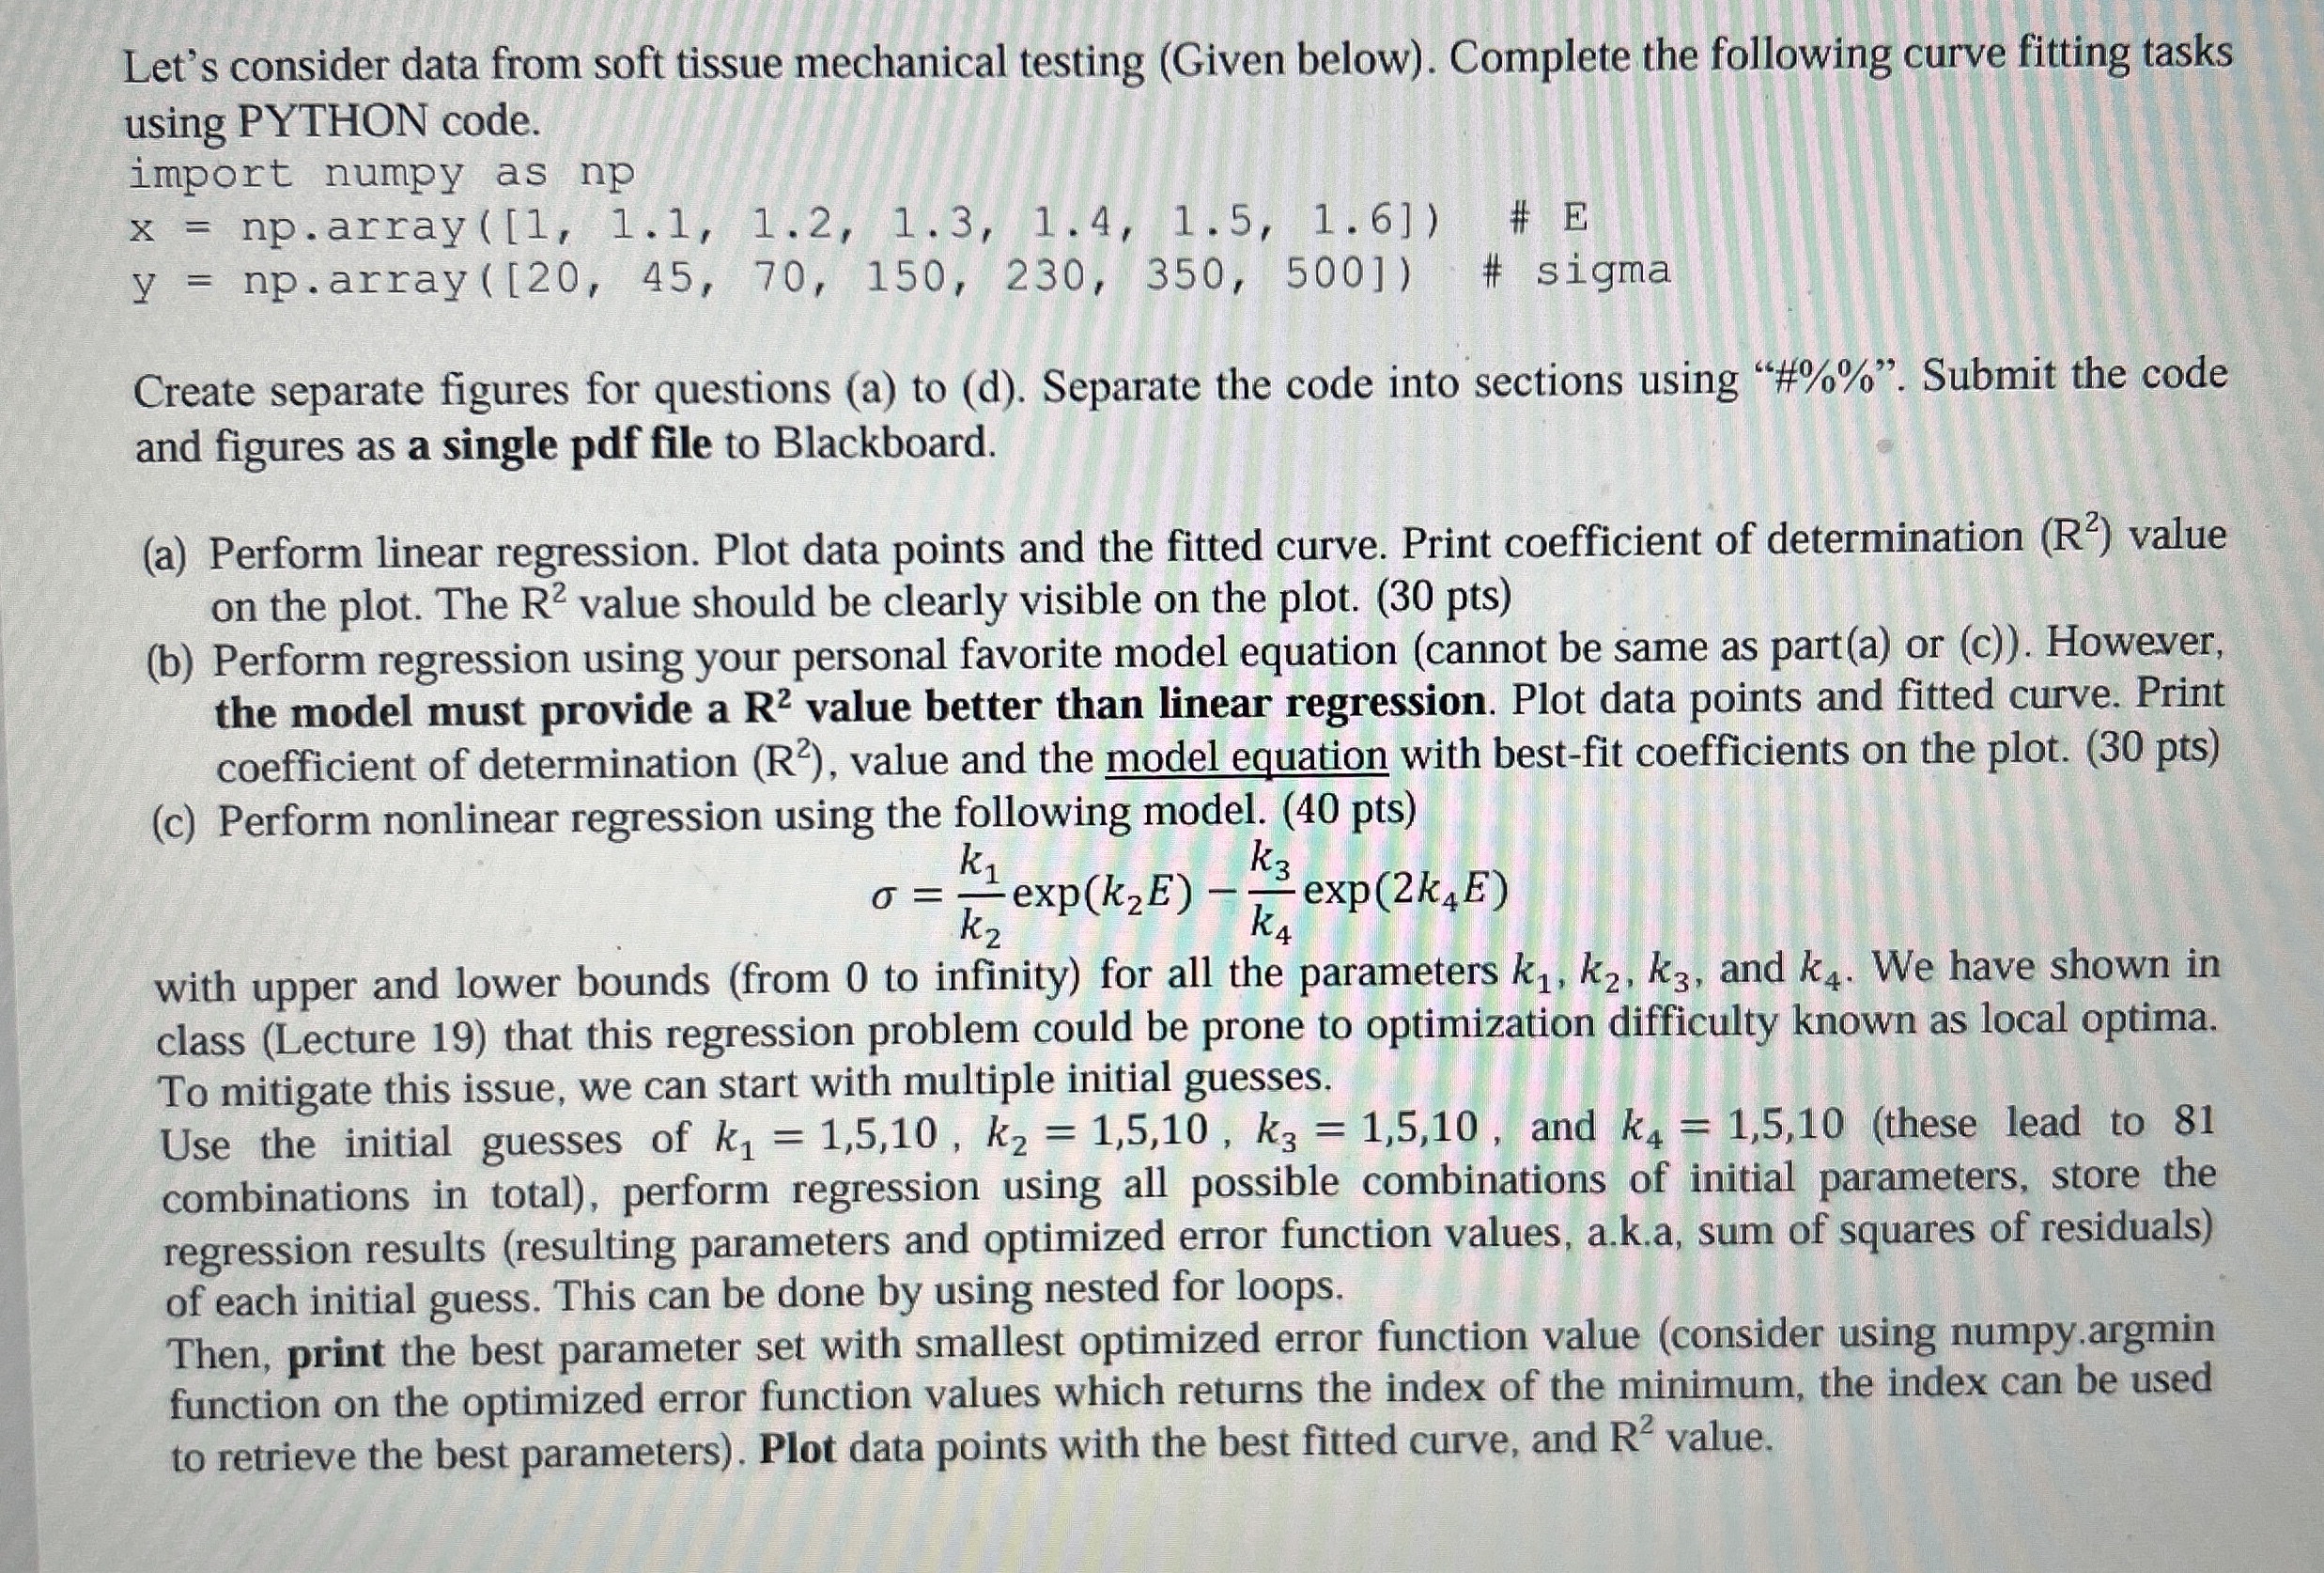
import numpy as np
array #
nparray # sigma
Create separate figures for questions a to d Separate the code into sections using # Submit the code and figures as a single pdf file to Blackboard.
a Perform linear regression. Plot data points and the fitted curve. Print coefficient of determination value on the plot. The value should be clearly visible on the plot. pts
b Perform regression using your personal favorite model equation cannot be same as parta or c However, the model must provide a value better than linear regression. Plot data points and fitted curve. Print coefficient of determination value and the model equation with bestfit coefficients on the plot. pts
c Perform nonlinear regression using the following model. pts
expexp
with upper and lower bounds from to infinity for all the parameters and We have shown in class Lecture that this regression problem could be prone to optimization difficulty known as local optima. To mitigate this issue, we can start with multiple initial guesses.
Use the initial guesses of and these lead to combinations in total perform regression using all possible combinations of initial parameters, store the regression results resulting parameters and optimized error function values, aka sum of squares of residuals of each initial guess. This can be done by using nested for loops.
Then, print the best parameter set with smallest optimized error function value consider using numpy.argmin function on the optimized error function values which returns the index of the minimum, the index can be used to retrieve the best parameters Plot data points with the best fitted curve, and value.
Step by Step Solution
There are 3 Steps involved in it
1 Expert Approved Answer
Step: 1 Unlock

Question Has Been Solved by an Expert!
Get step-by-step solutions from verified subject matter experts
Step: 2 Unlock
Step: 3 Unlock