

Question: Starting code: import numpy as np import numpy.random as rnd import matplotlib.pyplot as plt np.random.seed(42) m = 100 X = 6 * np.random.rand(m, 1) -
Starting code:
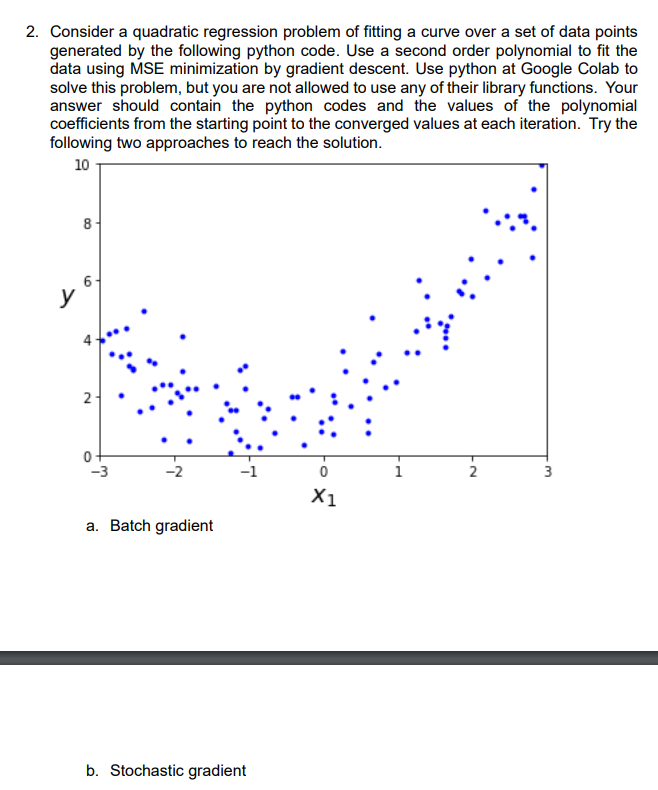
import numpy as np import numpy.random as rnd import matplotlib.pyplot as plt np.random.seed(42) m = 100 X = 6 * np.random.rand(m, 1) - 3 y = 0.5 * X**2 + X + 2 + np.random.randn(m, 1) plt.plot(X, y, "b.") plt.xlabel("$x_1$", fontsize=18) plt.ylabel("$y$", rotation=0, fontsize=18) plt.axis([-3, 3, 0, 10]) plt.show()
2. Consider a quadratic regression problem of fitting a curve over a set of data points generated by the following python code. Use a second order polynomial to fit the data using MSE minimization by gradient descent. Use python at Google Colab to solve this problem, but you are not allowed to use any of their library functions. Your answer should contain the python codes and the values of the polynomial coefficients from the starting point to the converged values at each iteration. Try the following two approaches to reach the solution. a. vaicil yiauicit
Step by Step Solution
There are 3 Steps involved in it

Get step-by-step solutions from verified subject matter experts