

Question: Let's first plot a function from high-school: the sine function from drawtool import DrawTool import math dt = DrawTool() dt.set_XY_range(0,6.28, -1,1) n = 100 x_spacing
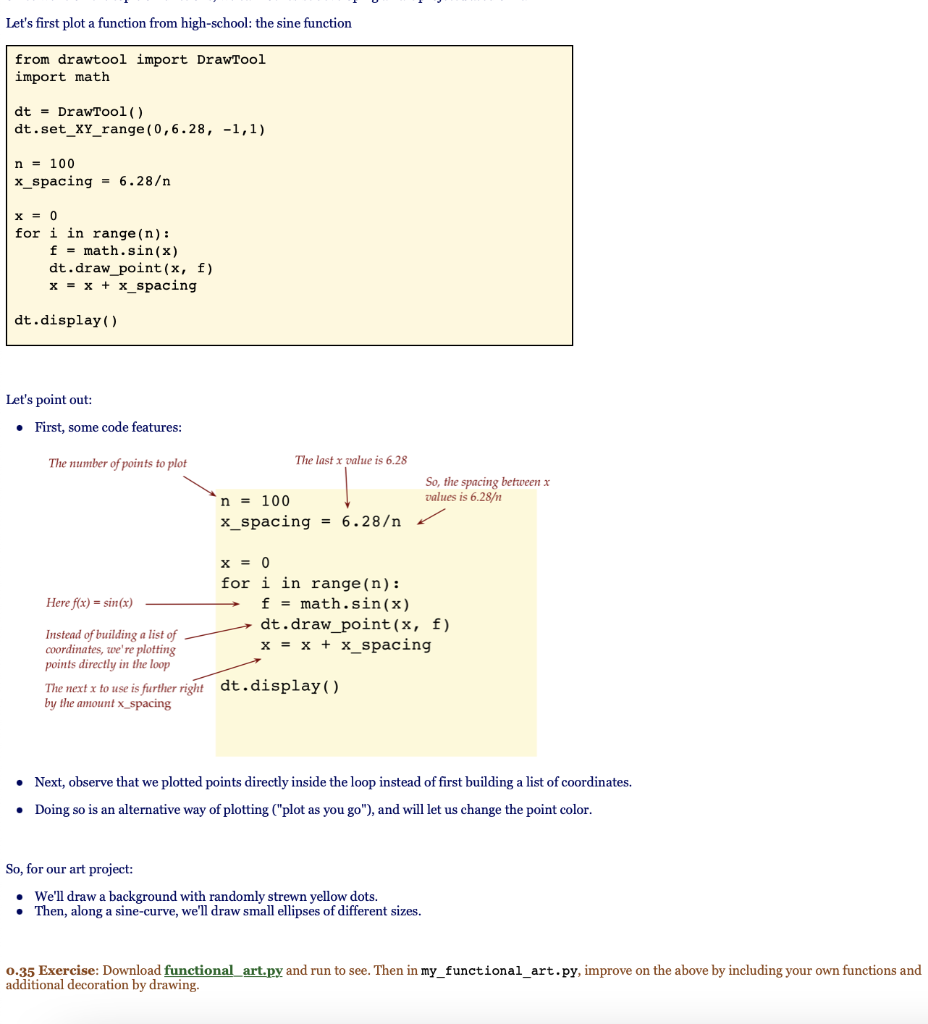
Let's first plot a function from high-school: the sine function from drawtool import DrawTool import math dt = DrawTool() dt.set_XY_range(0,6.28, -1,1) n = 100 x_spacing = 6.28 x = 0 for i in range(n): f = math.sin(x) dt.draw_point(x, f) x = x + x_spacing dt.display ( ) Let's point out: First, some code features: The number of points to plot The last x value is 6.28 So, the spacing between x values is 6.28 n = 100 x_spacing = 6.28 x = 0 for i in range(n): Here f(x) = sin(x) f = math.sin(x) dt.draw_point(x, f) Instead of building a list of coordinates, we're plotting x = x + x_spacing points directly in the loop The next x to use is further right dt.display ( ) by the amount x_spacing Next, observe that we plotted points directly inside the loop instead of first building a list of coordinates. Doing so is an alternative way of plotting ("plot as you go"), and will let us change the point color. So, for our art project: We'll draw a background with randomly strewn yellow dots. Then, along a sine-curve, we'll draw small ellipses of different sizes. 0.35 Exercise: Download functional art.py and run to see. Then in my_functional_art.py, improve on the above by including your own functions and additional decoration by drawing
Step by Step Solution
There are 3 Steps involved in it

Get step-by-step solutions from verified subject matter experts