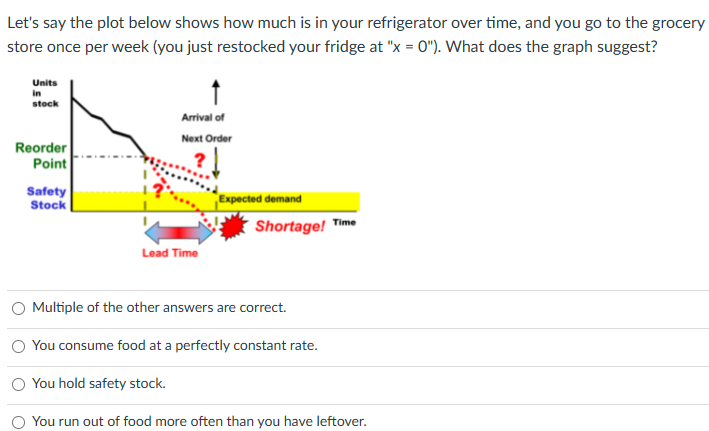
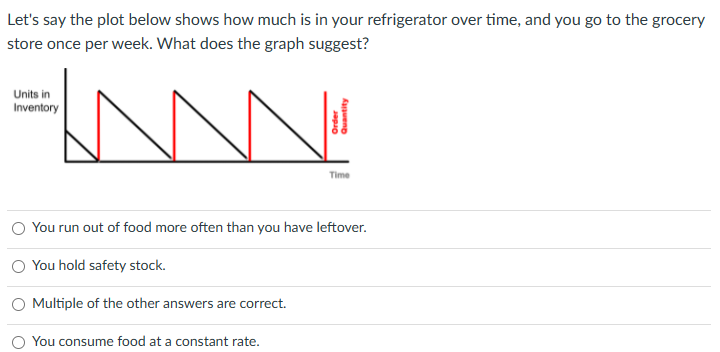
Question: Let's say the plot below shows how much is in your refrigerator over time, and you go to the grocery store once per week (you

Let's say the plot below shows how much is in

Let's say the plot below shows how much is in

Let's say the plot below shows how much is in your refrigerator over time, and you go to the grocery store once per week (you just restocked your fridge at "x = 0"). What does the graph suggest? Units in stock Arrival of Next Order ? Reorder Point Safety Stock Expected demand Shortage! Time Lead Time Multiple of the other answers are correct. You consume food at a perfectly constant rate. You hold safety stock. You run out of food more often than you have leftover. Let's say the plot below shows how much is in your refrigerator over time, and you go to the grocery store once per week. What does the graph suggest? Units in Inventory un Time You run out of food more often than you have leftover. You hold safety stock. Multiple of the other answers are correct. You consume food at a constant rate

Step by Step Solution

There are 3 Steps involved in it

1 Expert Approved Answer
Step: 1 Unlock blur-text-image
Question Has Been Solved by an Expert!

Get step-by-step solutions from verified subject matter experts

Step: 2 Unlock
Step: 3 Unlock

Students Have Also Explored These Related General Management Questions!