

Question: Question 10 1 pts Let's say the plot below shows how much is in your refrigerator over time, and you go to the grocery store
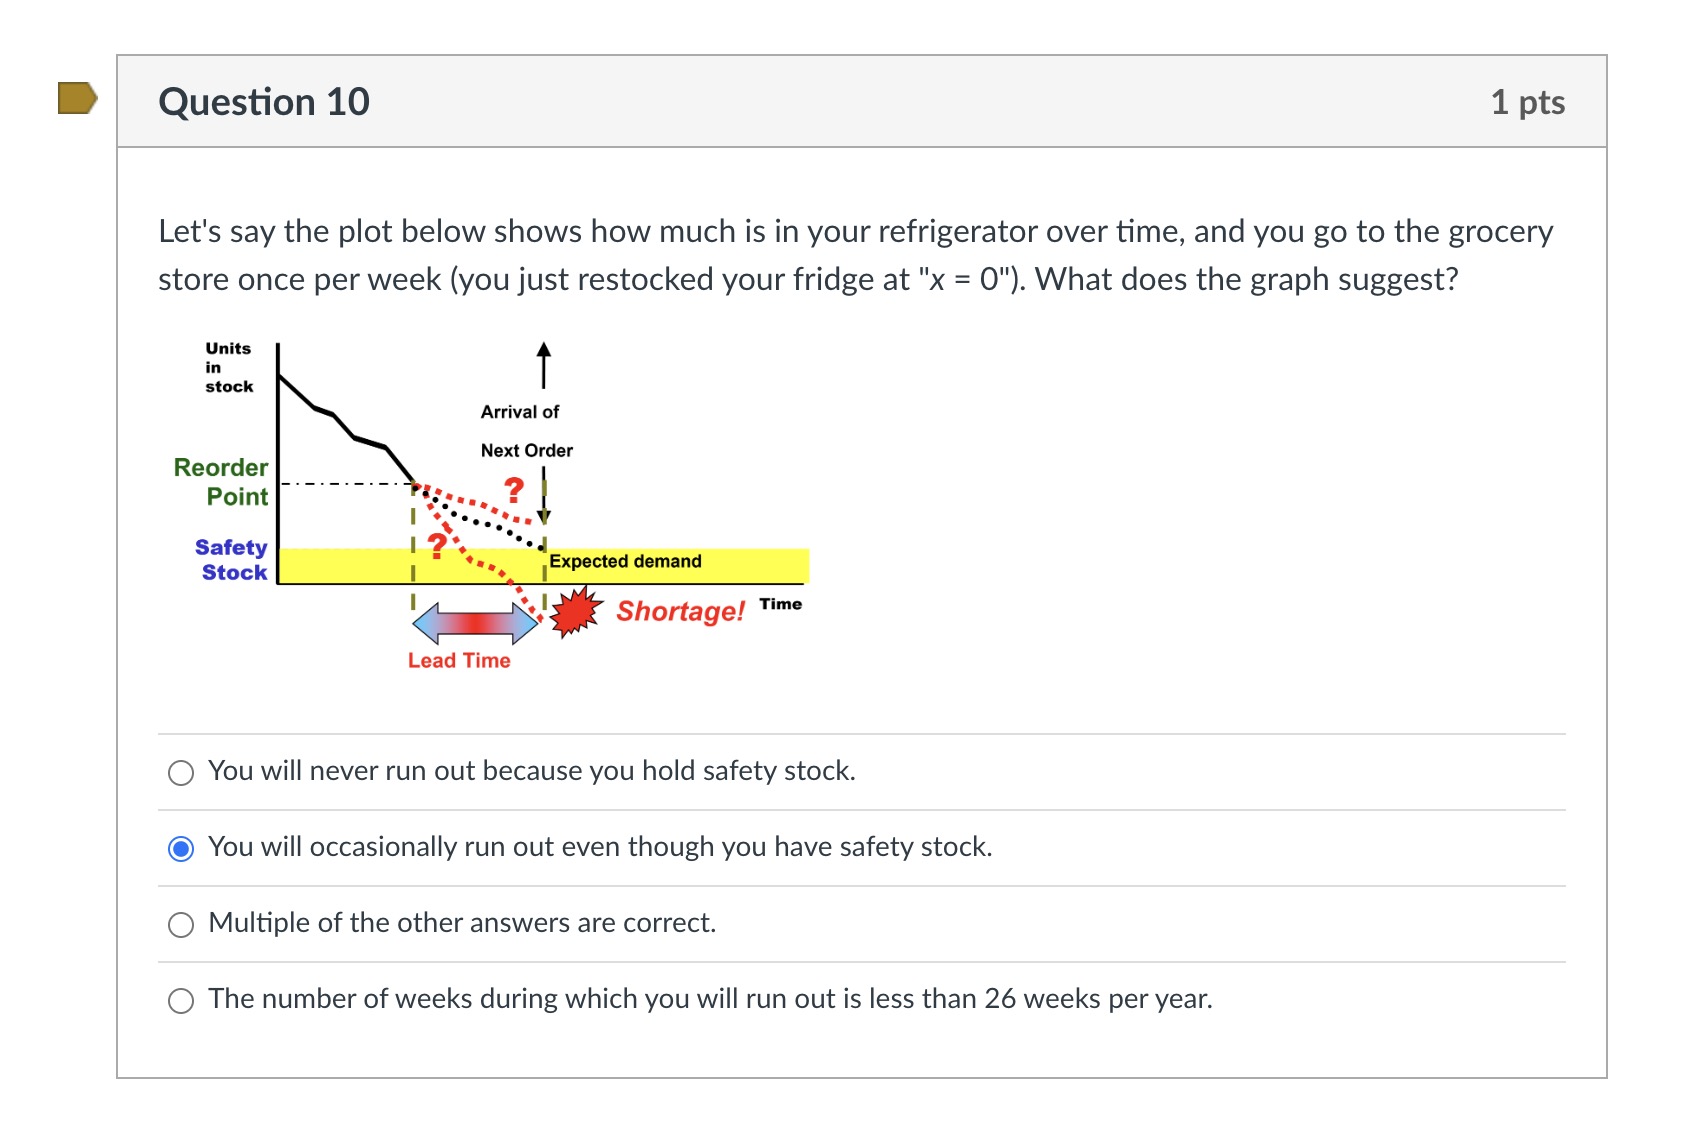
Question 10 1 pts Let's say the plot below shows how much is in your refrigerator over time, and you go to the grocery store once per week (you just restocked your fridge at "x = 0"). What does the graph suggest? Units in stock Arrival of Next Order Reorder Point . . . . . . . . . J Safety Stock Expected demand Shortage! Time Lead Time O You will never run out because you hold safety stock. You will occasionally run out even though you have safety stock. O Multiple of the other answers are correct. O The number of weeks during which you will run out is less than 26 weeks per year
Step by Step Solution
There are 3 Steps involved in it
1 Expert Approved Answer
Step: 1 Unlock

Question Has Been Solved by an Expert!
Get step-by-step solutions from verified subject matter experts
Step: 2 Unlock
Step: 3 Unlock