

Question: List 3 data 'headlines' as we discussed in lab 4 . Examples: San Francisco has the best value in Airbnb listings when comparing price to
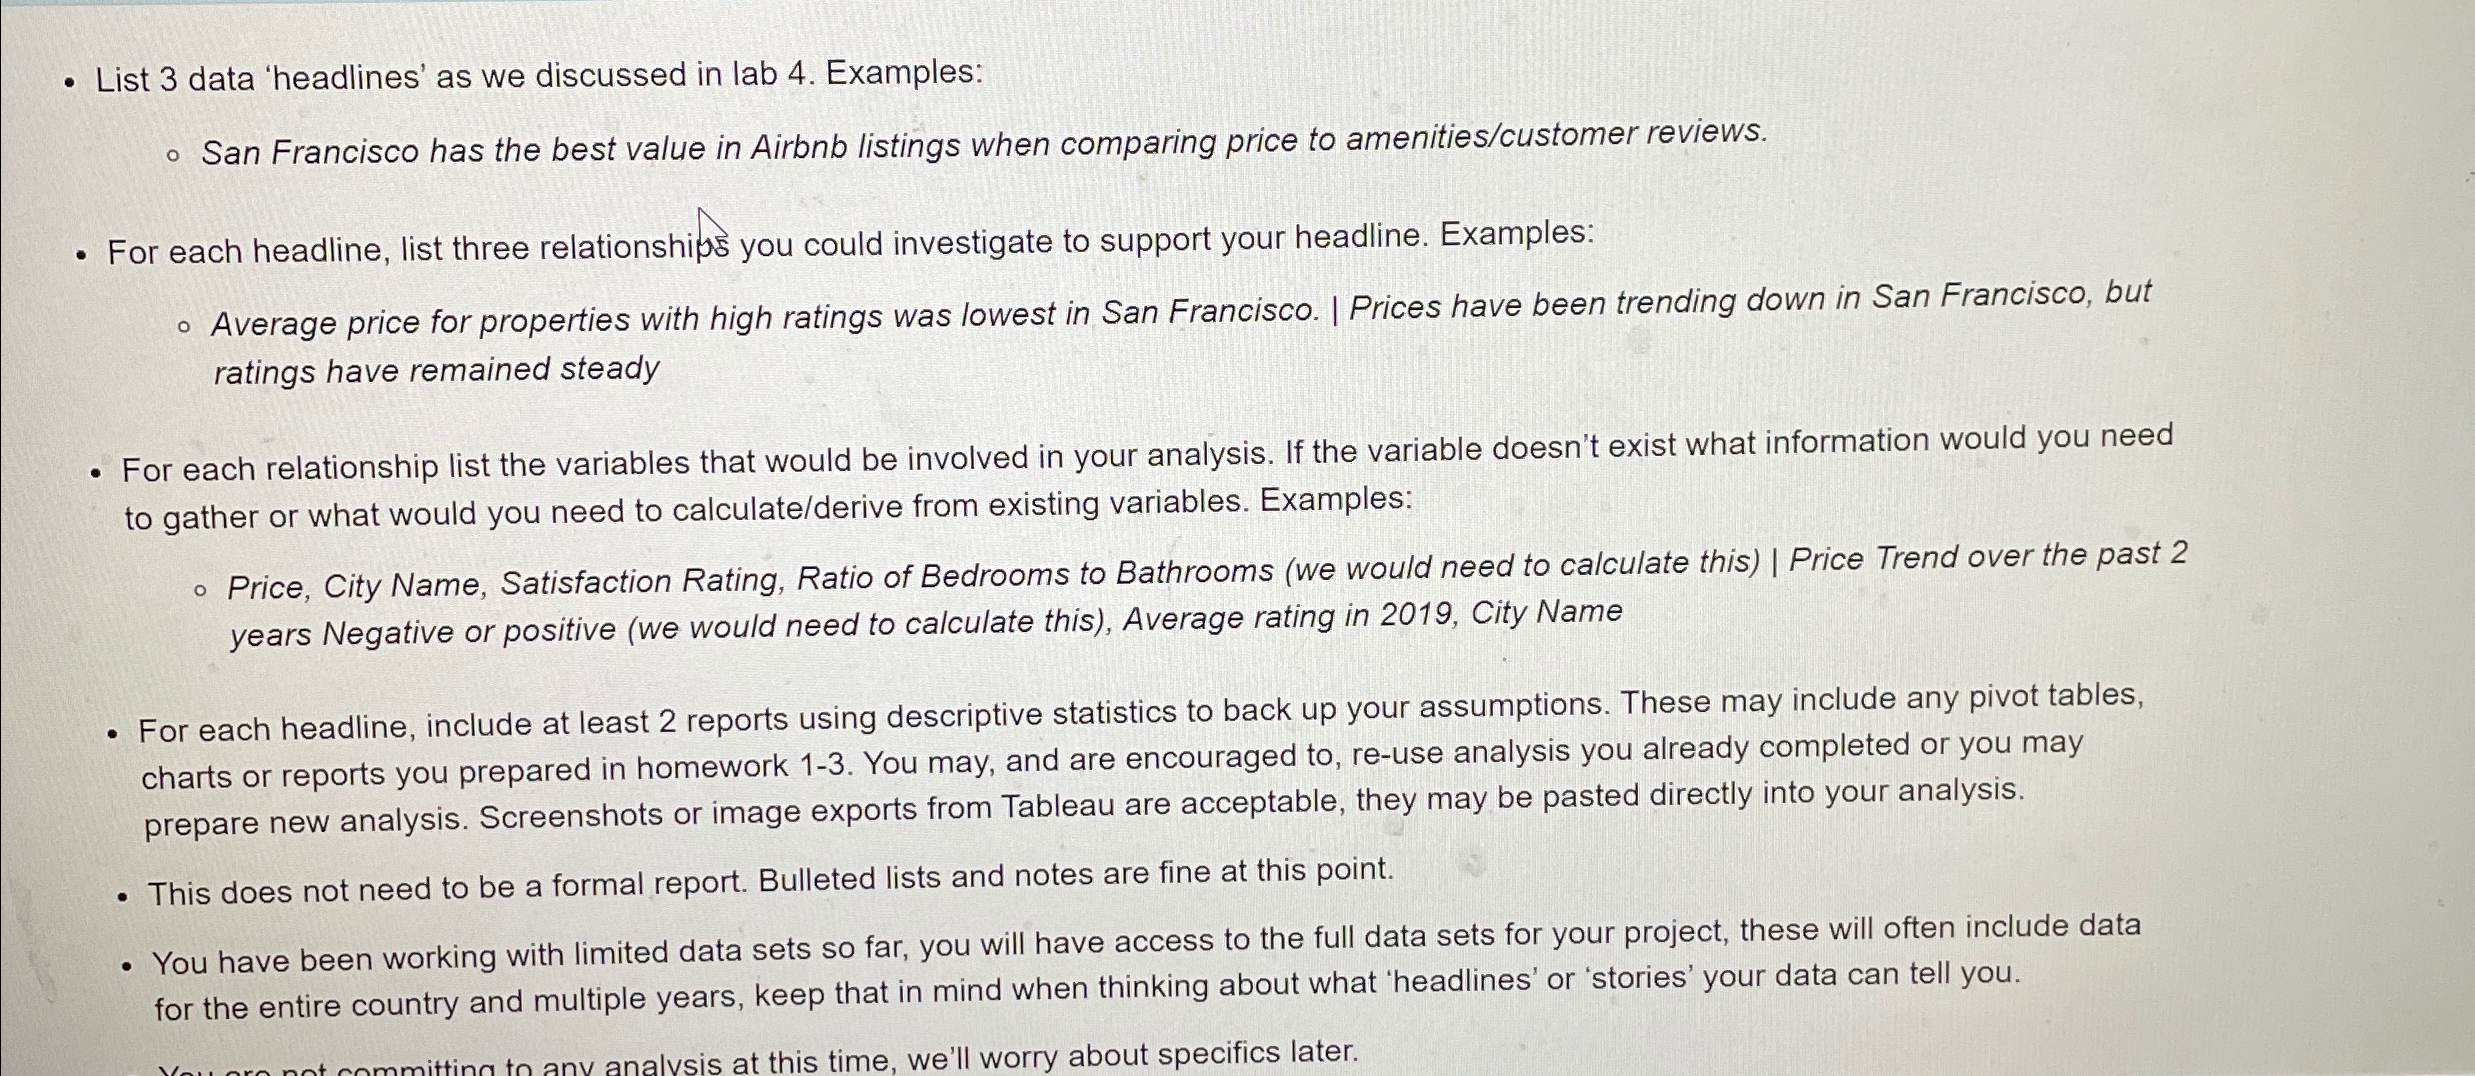
List data 'headlines' as we discussed in lab Examples:
San Francisco has the best value in Airbnb listings when comparing price to amenitiescustomer reviews.
For each headline, list three relationships you could investigate to support your headline. Examples:
Average price for properties with high ratings was lowest in San Francisco. I Prices have been trending down in San Francisco, but ratings have remained steady
For each relationship list the variables that would be involved in your analysis. If the variable doesn't exist what information would you need to gather or what would you need to calculatederive from existing variables. Examples:
Price, City Name, Satisfaction Rating, Ratio of Bedrooms to Bathrooms we would need to calculate this Price Trend over the past years Negative or positive we would need to calculate this Average rating in City Name
For each headline, include at least reports using descriptive statistics to back up your assumptions. These may include any pivot tables, charts or reports you prepared in homework You may, and are encouraged to reuse analysis you already completed or you may prepare new analysis. Screenshots or image exports from Tableau are acceptable, they may be pasted directly into your analysis.
This does not need to be a formal report. Bulleted lists and notes are fine at this point.
You have been working with limited data sets so far, you will have access to the full data sets for your project, these will often include data for the entire country and multiple years, keep that in mind when thinking about what 'headlines' or 'stories' your data can tell you.
Step by Step Solution
There are 3 Steps involved in it
1 Expert Approved Answer
Step: 1 Unlock

Question Has Been Solved by an Expert!
Get step-by-step solutions from verified subject matter experts
Step: 2 Unlock
Step: 3 Unlock