

Question: Listed below are actual sales data, applied to derive various forecasting models. Actual Year sales 80 100 80 130 100 120 160 12 13
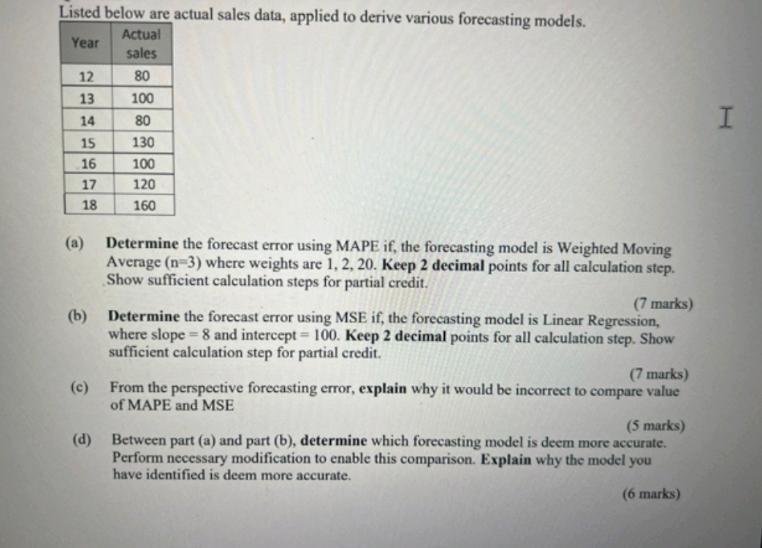
Listed below are actual sales data, applied to derive various forecasting models. Actual Year sales 80 100 80 130 100 120 160 12 13 14 15 16 17 18 @ Determine the forecast error using MAPE if, the forecasting model is Weighted Moving Average (n-3) where weights are 1, 2, 20. Keep 2 decimal points for all calculation step. Show sufficient calculation steps for partial credit. (7 marks) (b) Determine the forecast error using MSE if, the forecasting model is Linear Regression, where slope = 8 and intercept = 100. Keep 2 decimal points for all calculation step. Show sufficient calculation step for partial credit. (7 marks) (c) From the perspective forecasting error, explain why it would be incorrect to compare value of MAPE and MSE (5 marks) (d) Between part (a) and part (b), determine which forecasting model is deem more accurate. Perform necessary modification to enable this comparison. Explain why the model you have identified is deem more accurate. (6 marks) I
Step by Step Solution
There are 3 Steps involved in it
Sure I can help you with this Lets start with part a a Weighted Moving Average n3 with weights 1 2 and 20 Given actual sales data Year Actual Sales 12 ... View full answer

Get step-by-step solutions from verified subject matter experts