

Question: LO6 E5-48. Interpreting Graphical Data to Analyze R&D and Market Capitalization Consider the graphic below that depicts common-size R&D expense and the market-to-book ratio
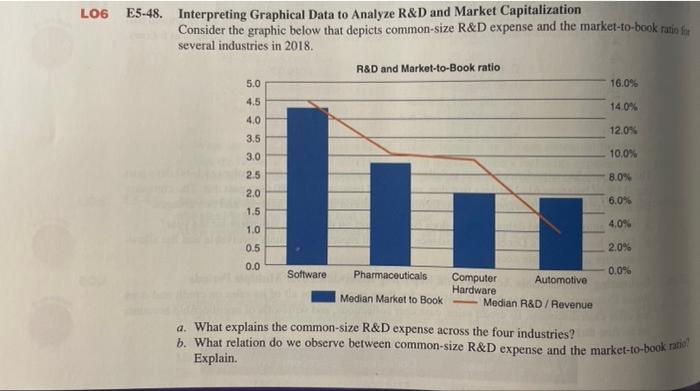
LO6 E5-48. Interpreting Graphical Data to Analyze R&D and Market Capitalization Consider the graphic below that depicts common-size R&D expense and the market-to-book ratio for several industries in 2018. R&D and Market-to-Book ratio 5.0 16.0% 4.5 14.0% 4.0 12.0% 3.5 10.0% 3.0 2.5 8.0% 2.0 6.0% 1.5 4.0% 1.0 0.5 2.0% 0.0 0.0% Software Pharmaceuticals Computer Hardware Median Market to Book Automotive Median R&D/Revenue a. What explains the common-size R&D expense across the four industries? b. What relation do we observe between common-size R&D expense and the market-to-book ratio? Explain.
Step by Step Solution
There are 3 Steps involved in it

Get step-by-step solutions from verified subject matter experts