

Question: Load the diamonds data collection from the { ggplot 2 } package and look at the data using the View function. Then answer the following
Load the diamonds data collection from the ggplot package and look at the data using the View function. Then answer the following questions. Value Check
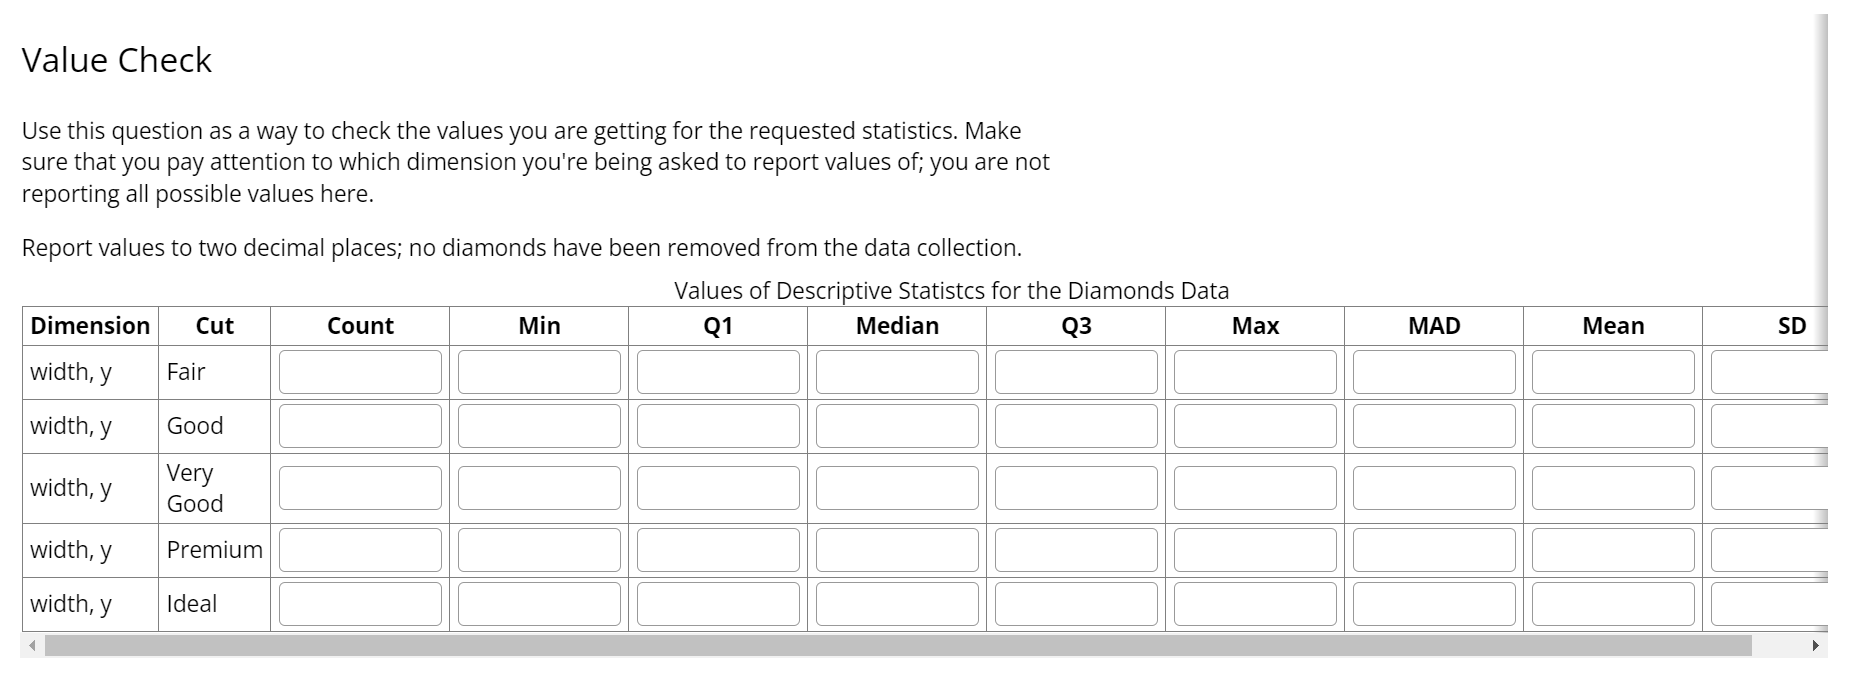
Use this question as a way to check the values you are getting for the requested statistics. Make sure that you pay attention to which dimension you're being asked to report values of; you are not reporting all possible values here.
Report values to two decimal places; no diamonds have been removed from the data collection.
Values of Descriptive Statistcs for the Diamonds Data Value Check
Use this question as a way to check the values you are getting for the requested statistics. Make sure that you pay attention to which dimension you're being asked to report values of; you are not reporting all possible values here.
Report values to two decimal places; no diamonds have been removed from the data collection.
Values of Descriptive Statistcs for the Diamonds Data
begintabularccccccccccc
hline Dimension & Cut & Count & Min & Q & Median & Q & Max & MAD & Mean & SD
hline width, y & Fair & & & & & & & & &
hline width, y & Good & & & & & & & & &
hline width, y & begintabularl
Very
Good
endtabular & & & & & & & & &
hline width, y & Premium & & & & & & & & &
hline width, y & Ideal & & & & & & & & &
hline
endtabular
Step by Step Solution
There are 3 Steps involved in it
1 Expert Approved Answer
Step: 1 Unlock

Question Has Been Solved by an Expert!
Get step-by-step solutions from verified subject matter experts
Step: 2 Unlock
Step: 3 Unlock