

Question: Locational Break-Even Analysis Example - Plot the total cost lines on a single graph Total Cost = Fixed Cost + Variable Cost Per Unit *
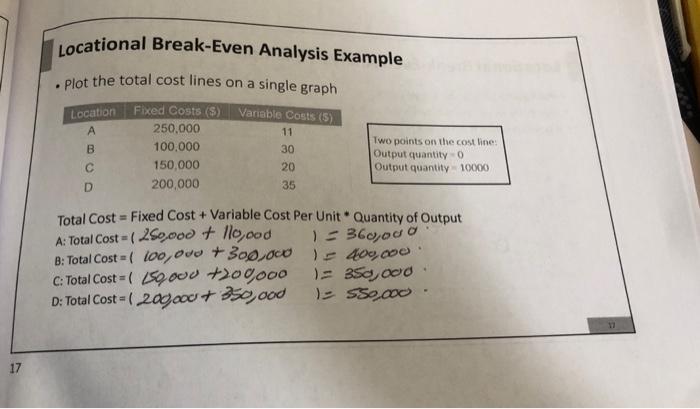
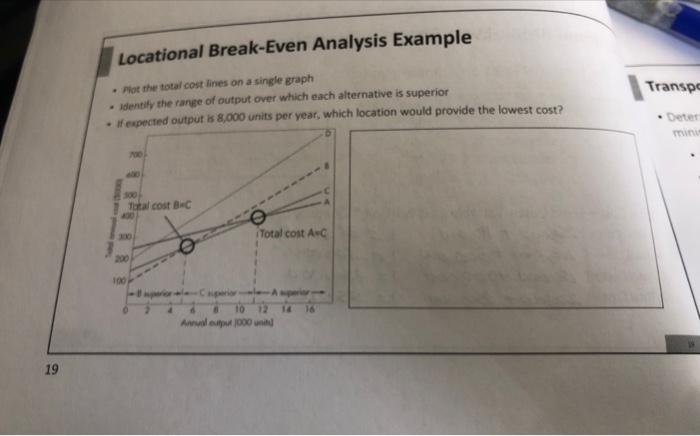
Locational Break-Even Analysis Example - Plot the total cost lines on a single graph Total Cost = Fixed Cost + Variable Cost Per Unit * Quantity of Output A: Total Cost =(250,000+110,0001=360,000. B: Total cost =(100,000+300,0001=400,000. c: Total cost =(150,000+200,0001=350,000. D: Total Cost =(200,000+350,0001=550,000. Locational Break-Even Analysis Example - Hot the total cost lines on a single graph - identily the range of output over which each alternative is superior Locational Break-Even Analysis Example - Plot the total cost lines on a single graph Total Cost = Fixed Cost + Variable Cost Per Unit * Quantity of Output A: Total Cost =(250,000+110,0001=360,000. B: Total cost =(100,000+300,0001=400,000. c: Total cost =(150,000+200,0001=350,000. D: Total Cost =(200,000+350,0001=550,000. Locational Break-Even Analysis Example - Hot the total cost lines on a single graph - identily the range of output over which each alternative is superior
Step by Step Solution
There are 3 Steps involved in it

Get step-by-step solutions from verified subject matter experts