

Question: Logarithmic functions: Modelling Data. Having trouble trying to figure out how to show my work. Not getting the same answers as my graph on my
Logarithmic functions: Modelling Data. Having trouble trying to figure out how to show my work. Not getting the same answers as my graph on my calculator
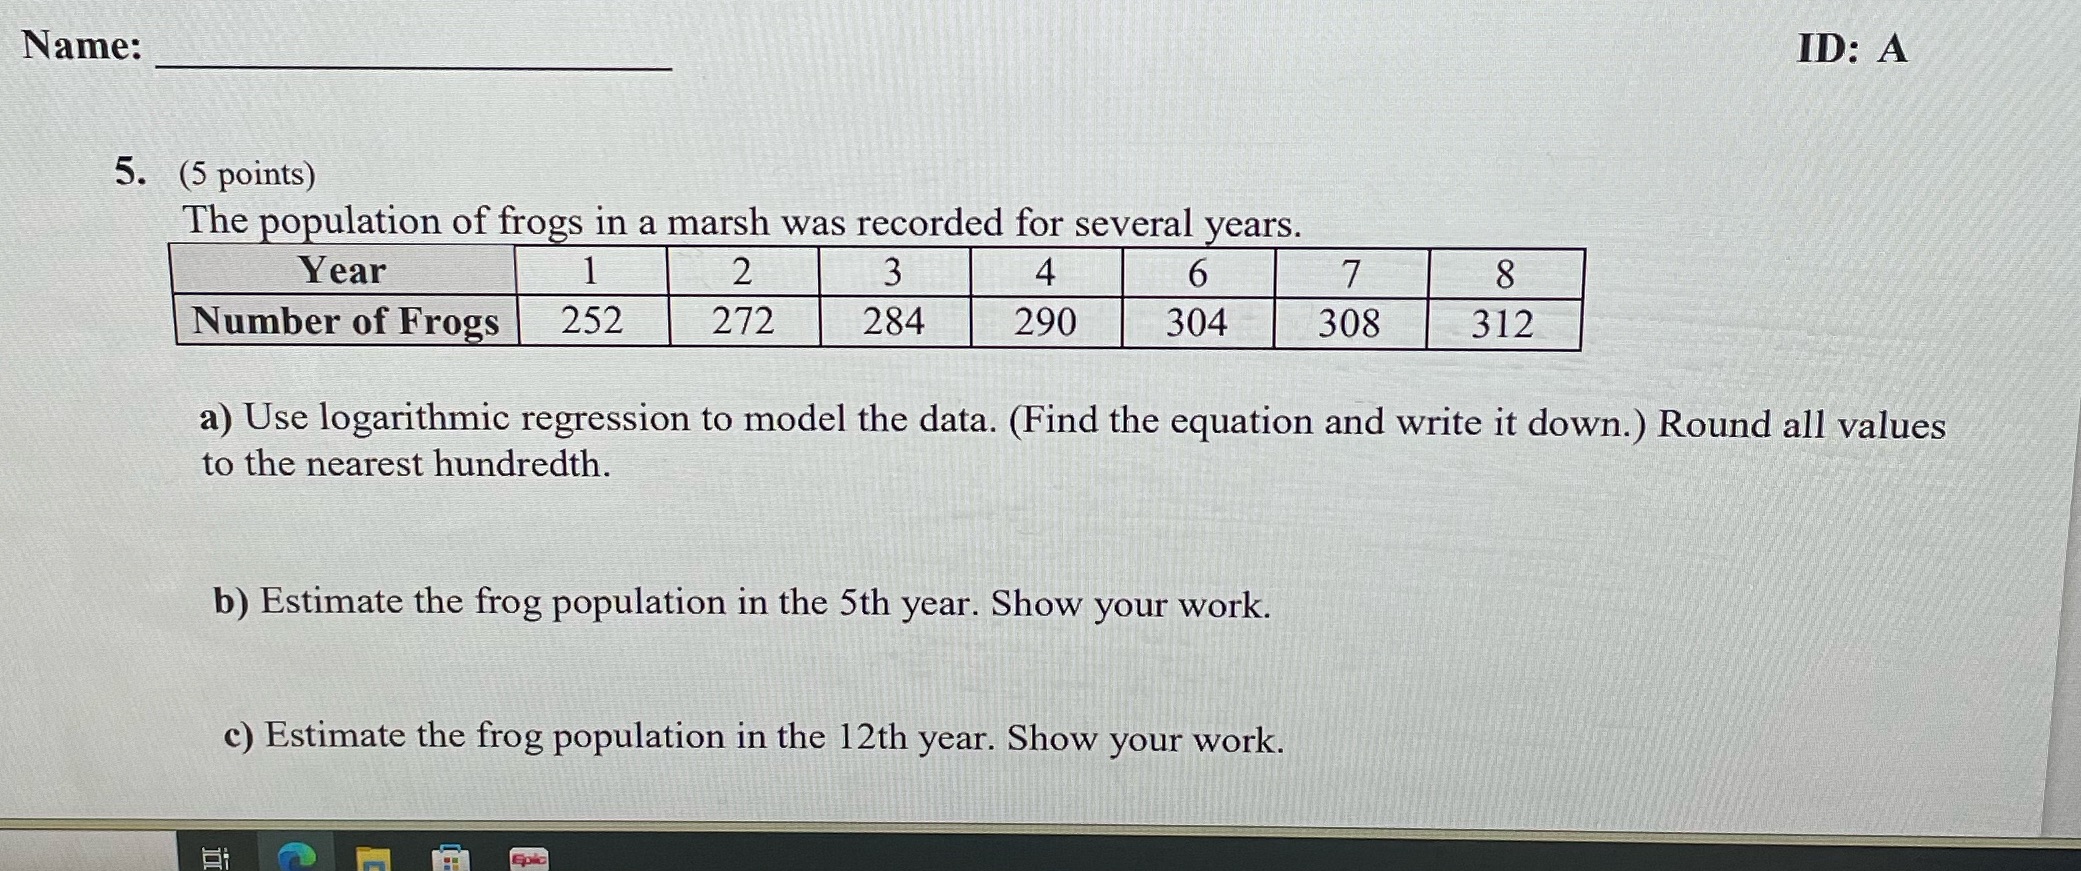
Name: ID: A 5. (5 points) The population of frogs in a marsh was recorded for several years. Year 1 2 3 4 6 7 8 Number of Frogs 252 272 284 290 304 308 312 a) Use logarithmic regression to model the data. (Find the equation and write it down.) Round all values to the nearest hundredth. b) Estimate the frog population in the 5th year. Show your work. c) Estimate the frog population in the 12th year. Show your work
Step by Step Solution
There are 3 Steps involved in it
1 Expert Approved Answer
Step: 1 Unlock

Question Has Been Solved by an Expert!
Get step-by-step solutions from verified subject matter experts
Step: 2 Unlock
Step: 3 Unlock