

Question: look at the graph and help with 2 questions I have attached the graph and question Figure: Costs of Price Ceilings P $9 S A
look at the graph and help with 2 questions I have attached the graph and question
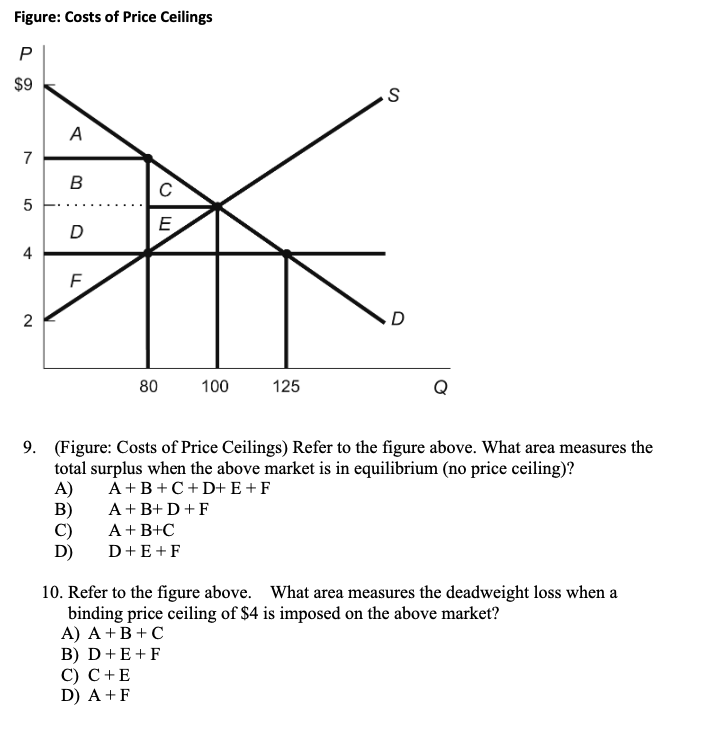
Figure: Costs of Price Ceilings P $9 S A B C 5 . . . D E 4 F 2 D 80 100 125 Q 9. (Figure: Costs of Price Ceilings) Refer to the figure above. What area measures the total surplus when the above market is in equilibrium (no price ceiling)? A A+ B + C+ D+E+F B) A + B+ D+F A + B+C D) D+ E+F 10. Refer to the figure above. What area measures the deadweight loss when a binding price ceiling of $4 is imposed on the above market? A) A + B+C B) D + E +F C) C+E D) A + F
Step by Step Solution
There are 3 Steps involved in it
1 Expert Approved Answer
Step: 1 Unlock

Question Has Been Solved by an Expert!
Get step-by-step solutions from verified subject matter experts
Step: 2 Unlock
Step: 3 Unlock