

Question: Please help with the questions below. All docs are attached. Thanks!! :) Question 1 Does your company compete in a world market arena characterized by
Please help with the questions below. All docs are attached. Thanks!! :)
Question 1
Does your company compete in a world market arena characterized by multi-country competition or global competition? Explain why.
Question 2
Which of the strategy options for competing in global markets discussed in this chapter is your company employing?
Question 3
Which one of the following best describes the strategic approach your company is taking to compete successfully in the 4 geographic regions comprising the global athletic footwear market? Think local, act local Think global, act global Think global, act local Explain your answer. Then, indicate two or three chief elements that characterize your company's strategic approach to competing in each of the four geographic regions: North America, Latin America, the Asia-Pacific region, and Europe-Africa.
Question 4
Is it your company's practice to ignore exchange rate changes or to adapt your strategy and decisions to (a) capitalize on favorable exchange rate changes (especially if the change is large) and (b) to minimize the adverse impact of unfavorable exchange rate changes? Identify at least two specific actions that your company can take to lessen the impact of unfavorable exchange rate changes on your company's financial performance?
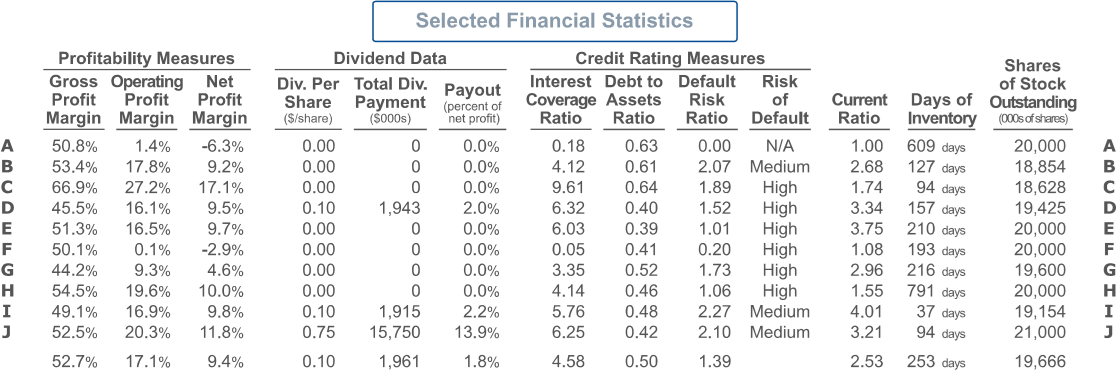
Question 5
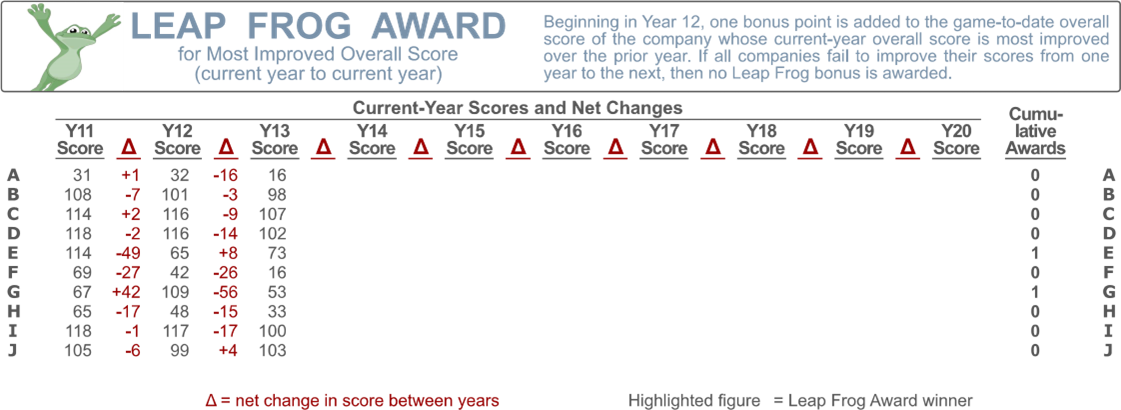
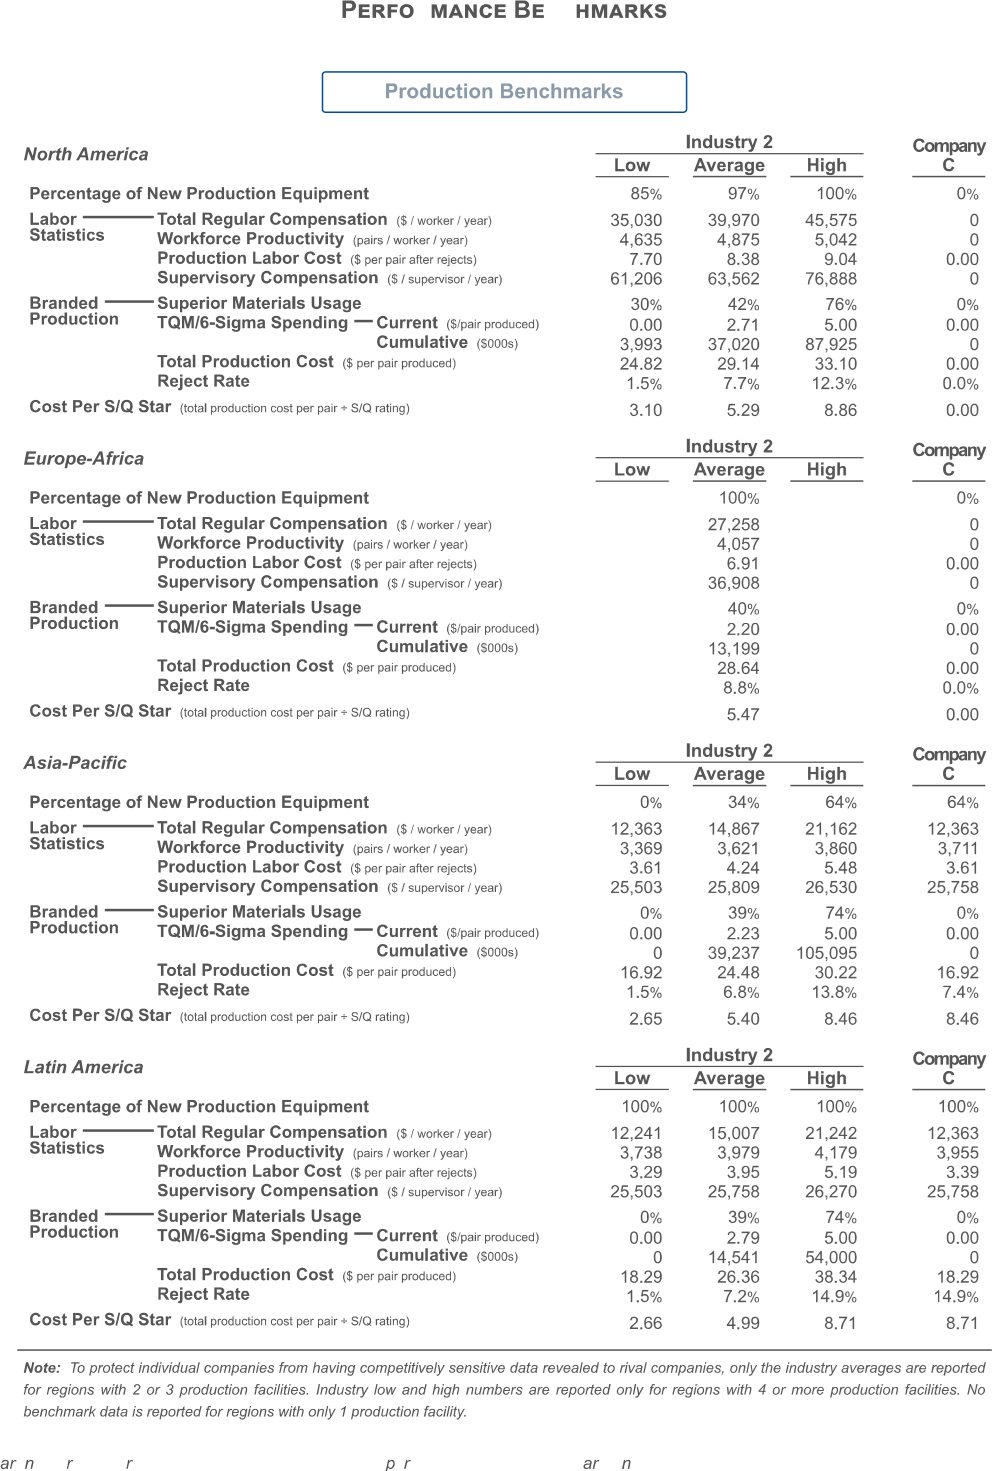
In what specific ways, if any, have you and your co-managers adapted your company's strategy to take into account geographic differences in import tariffs?
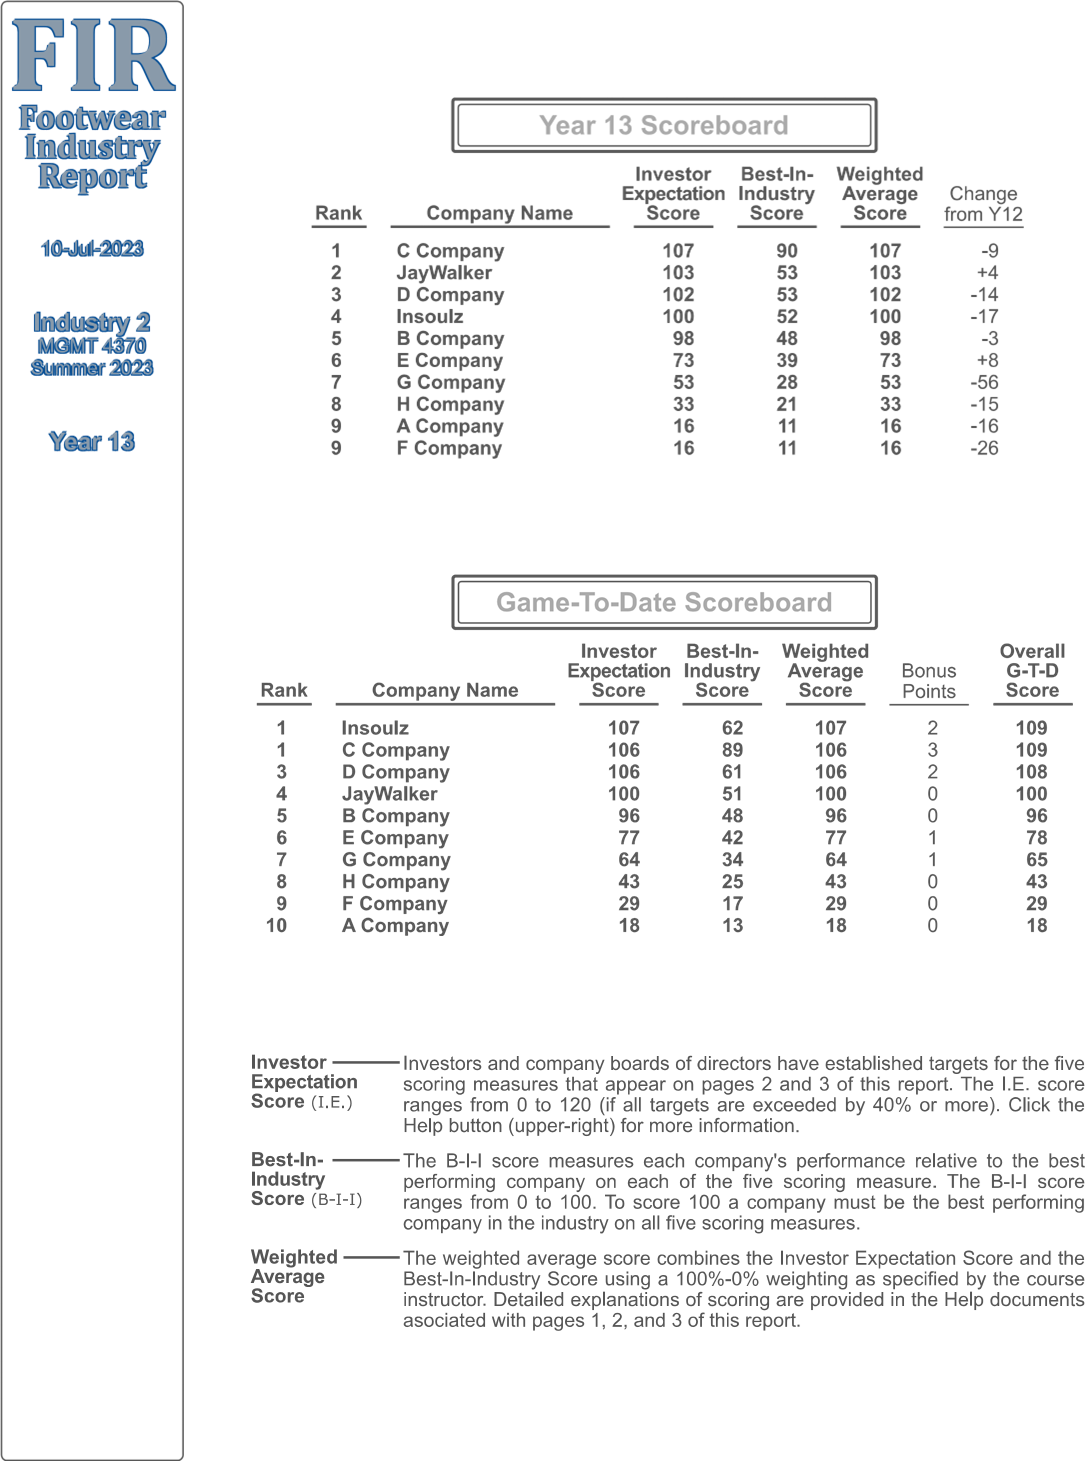
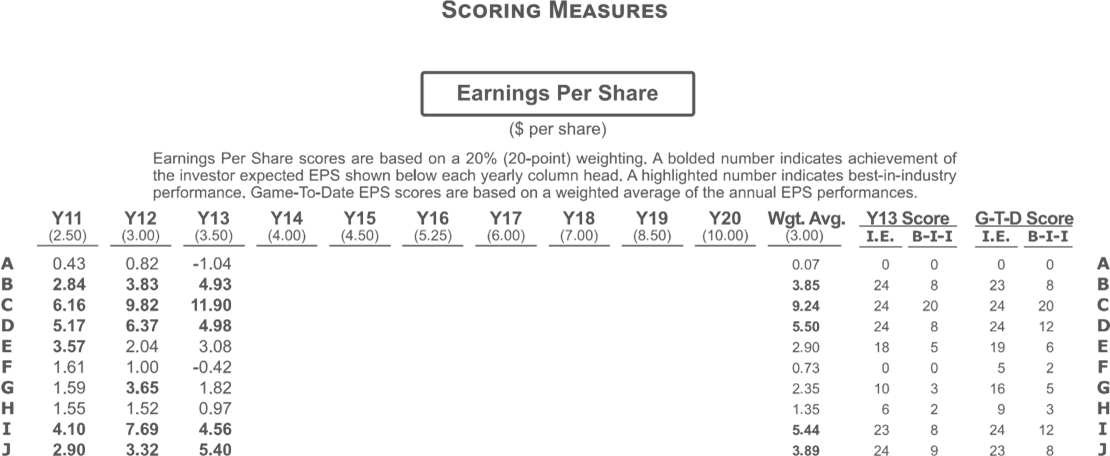
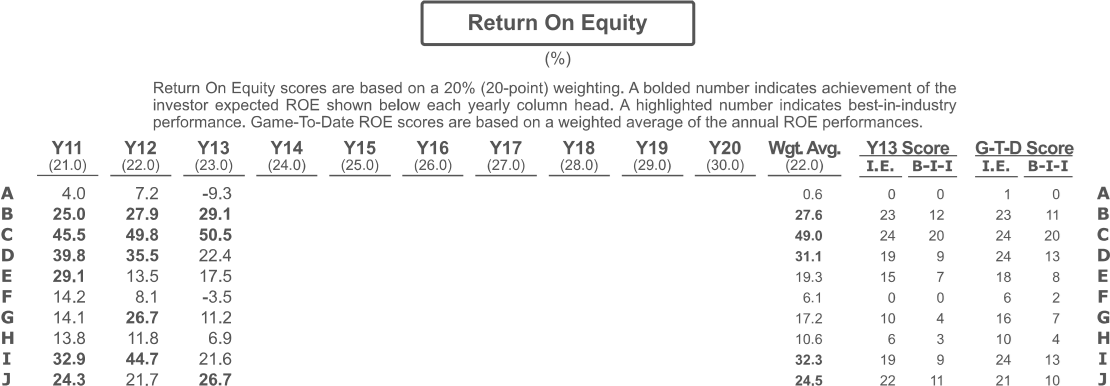
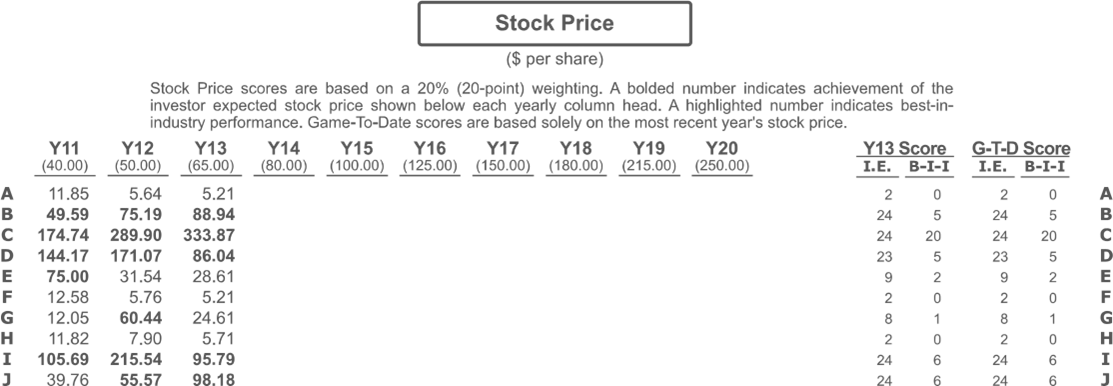
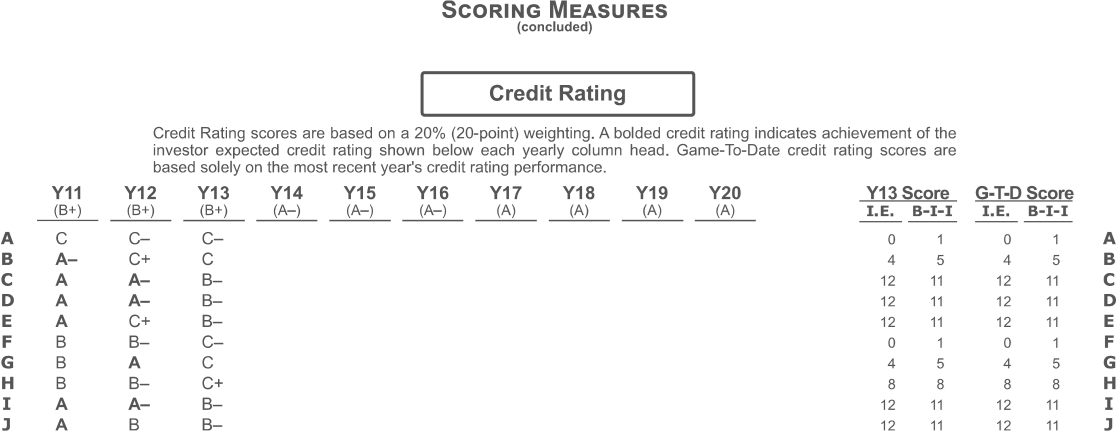
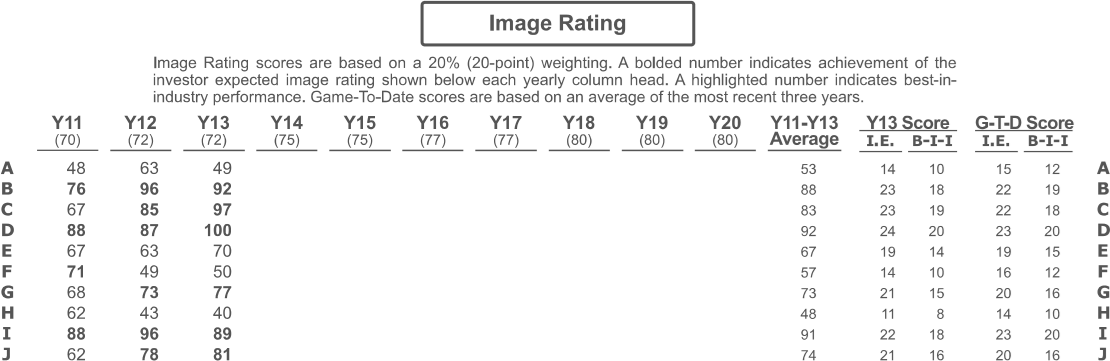
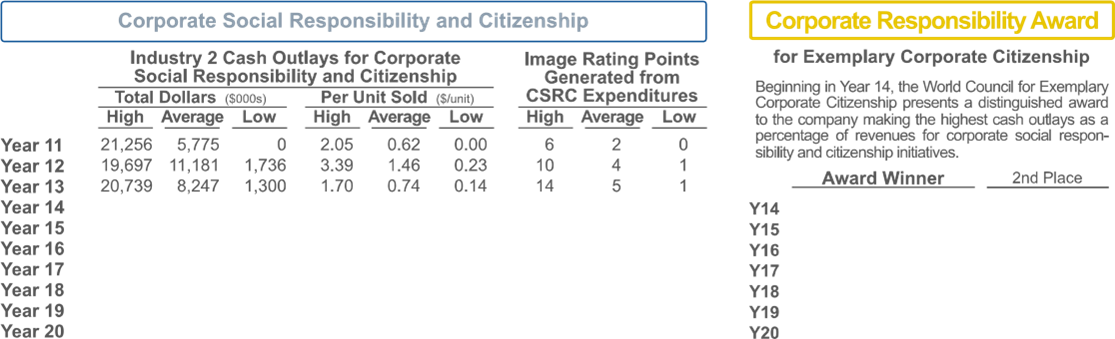
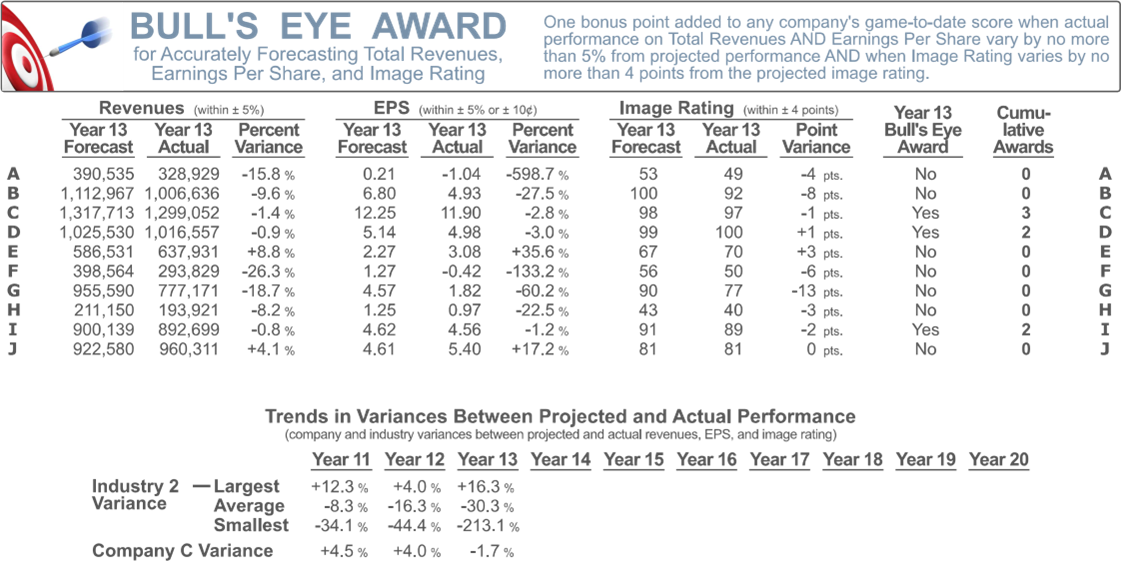
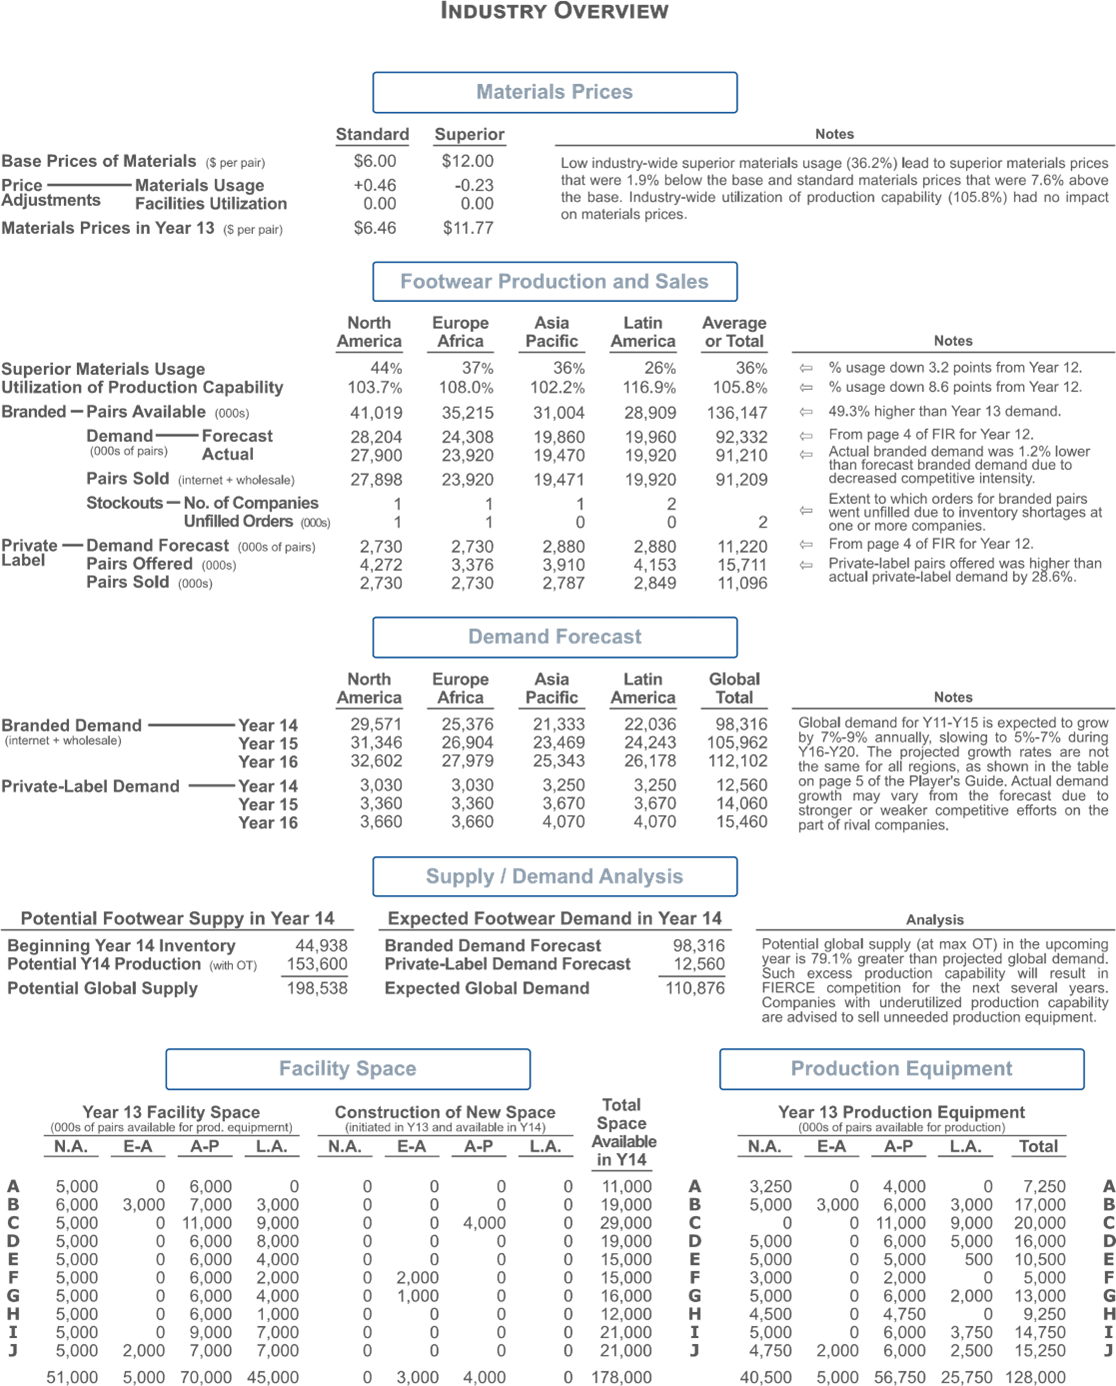
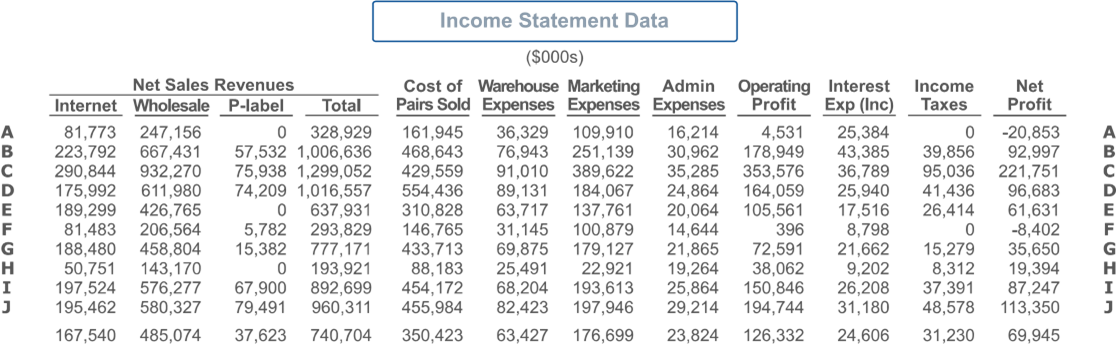
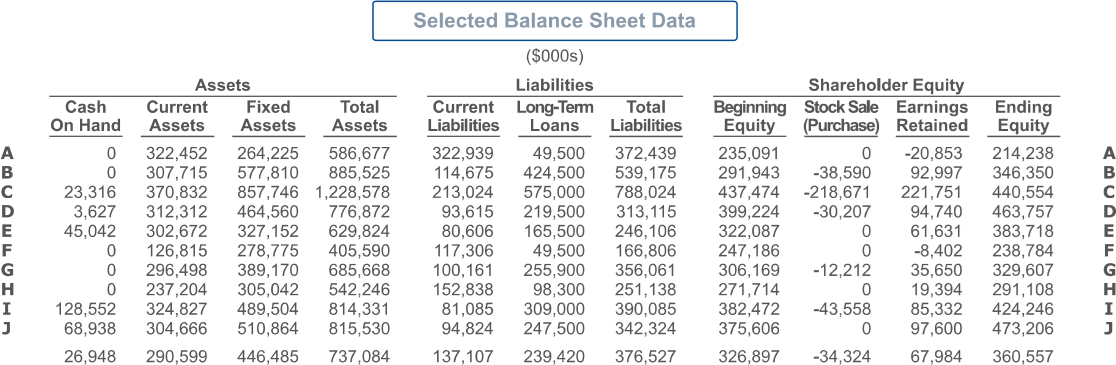
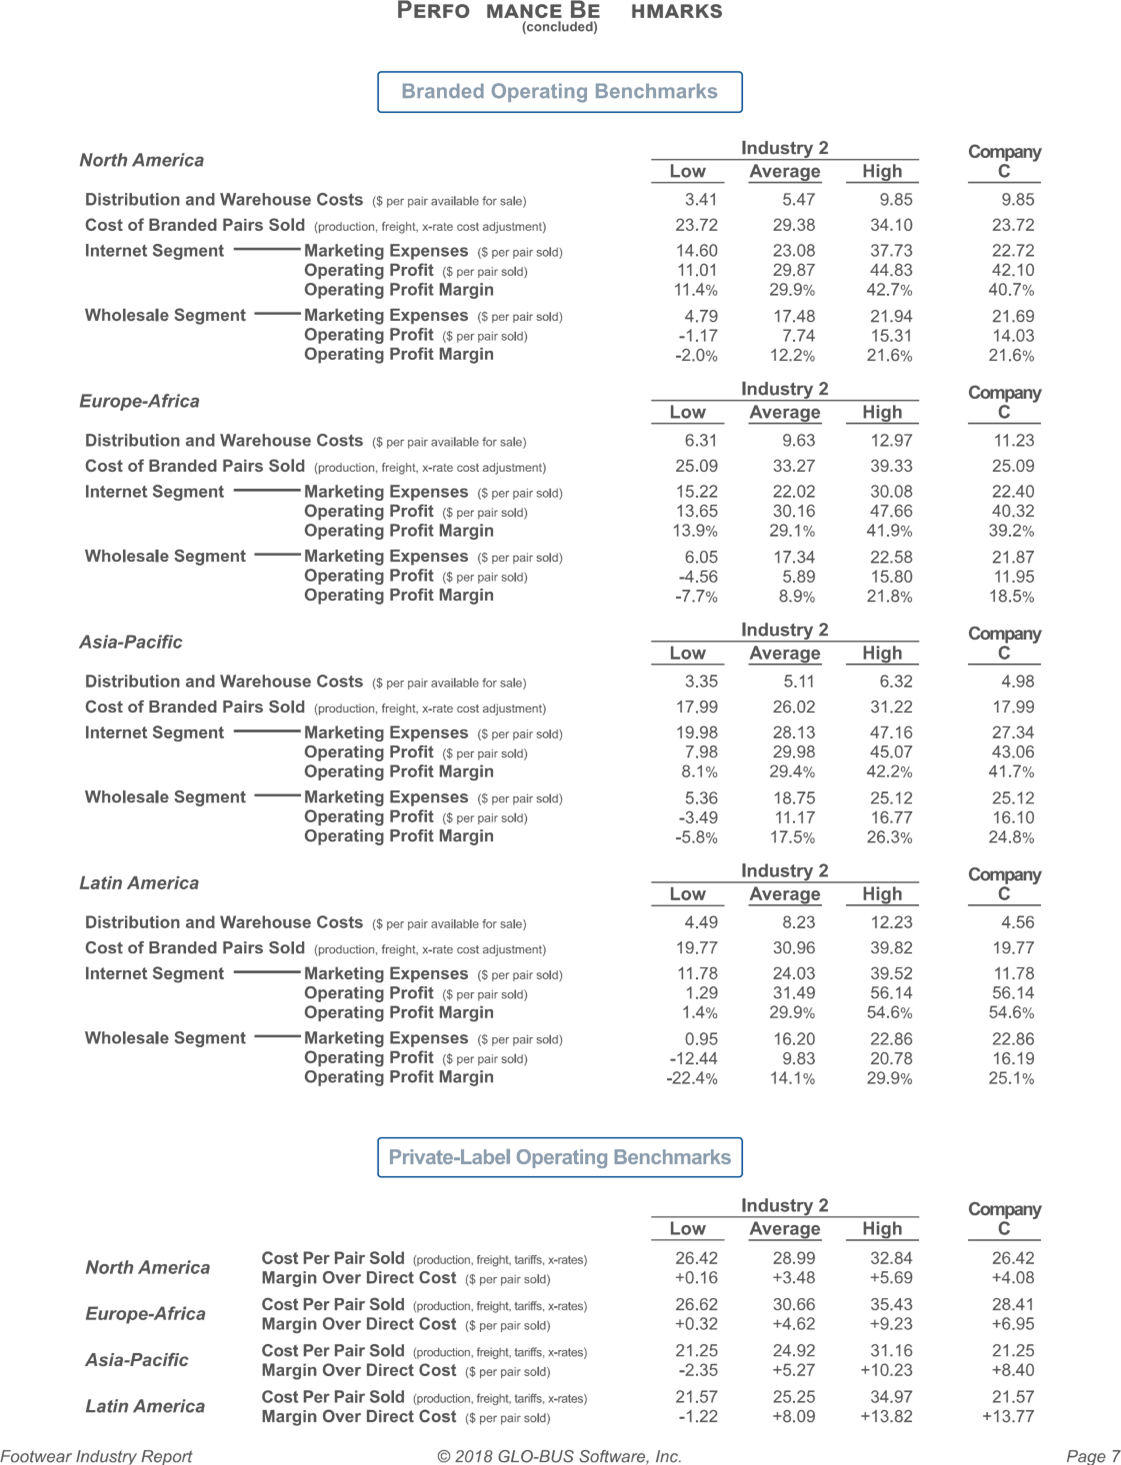
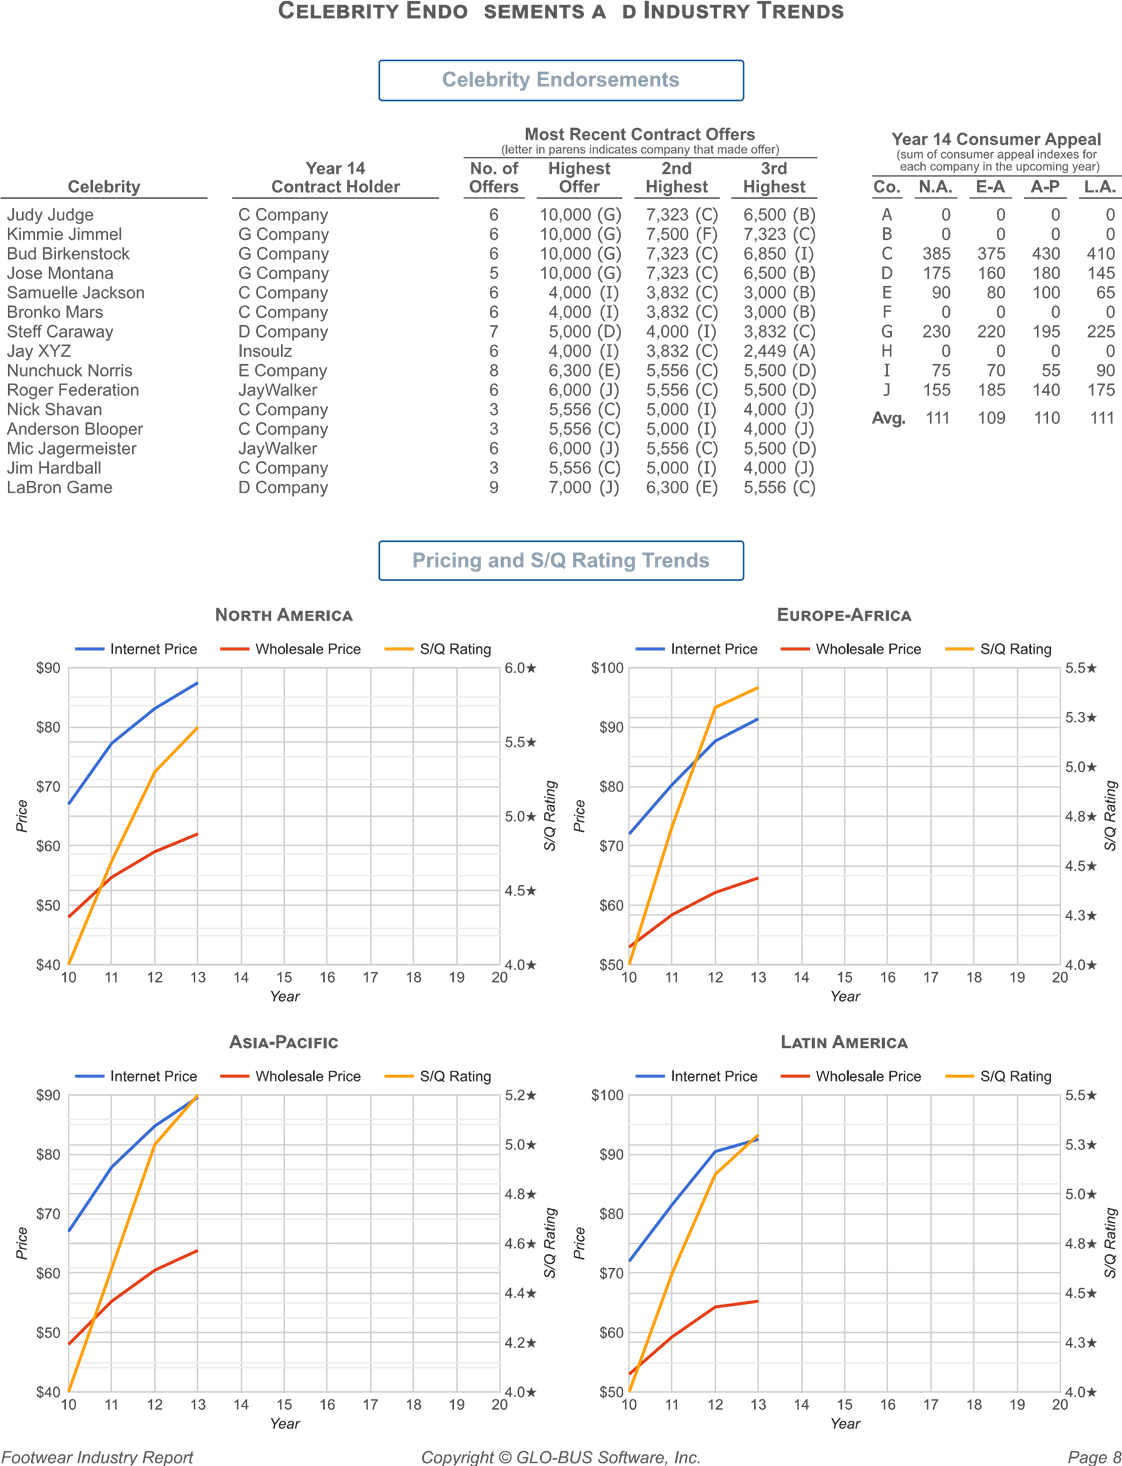
FIR Footwear Year 13 Scoreboard Industry Report Investor Best In- Weighted Expectation Industry Average Change Rank company Name score Score Score from Y12 10-Jul-2023 C Company 107 107 JayW +4 D Company -14 -17 Industry 2 Insoulz MGMT 4370 B Company 3 48 Summer 2023 E Company G Company H Company -15 A Company 16 -16 Year 13 F Company 16 -26 Game-To-Date Scoreboard Investor Best-In- Weighted Overall Expectation Industry Average Bonus GTD Rank Company Name Score Score Score Points Score Insoulz 107 62 107 109 C Company 106 89 106 109 D Company 106 61 106 108 SOONON JayWalker 100 51 100 B Company 96 48 96 96 E Company 77 42 78 G Company 64 34 64 65 H Company 43 25 43 43 F Company 29 17 29 29 10 A Company 18 13 18 18 Investor - Investors and company boards of directors have established targets for the five Expectation scoring measures that appear on pages 2 and 3 of this report. The I.E. score Score (I.E.) ranges from 0 to 120 (if all targets are exceeded by 40% or more). Click the Help button (upper-right) for more Information. Best In- The B-I-I score measures each company's performance relative to the best Industry performing company on each of the five scoring measure. The B-H score Score (B-I-I) ranges from 0 to 100. To score 100 a company must be the best performing company in the industry on all five scoring measures. Weighted- The weighted average score combines the Investor Expectation Score and the Average Best-In-Industry Score using a 100%-0% weighting as specified by the course Score instructor. Detailed explanations of scoring are provided in the Help documents asociated with pages 1, 2, and 3 of this report.SCORING MEASURES Earnings Per Share (per share) Eamings Per Share scores are based on a 20%% (20-point) weighting. A bolded number indicates achievement of the Investor expected EPS shown below each yearly column head. A highlighted number Indicates best in Industry performance. Game-To Date EPS scores are based on a weighted average of the annual EPS performances. Y11 Y12 Y13 Y14 Y15 Y16 Y17 Y18 Y19 Y20 Wat Avg Y13 Score (2.50) (3.00) 1350 (4 00) (6.00) (7:00) (8.50) (10.00) (3.00) LE IE BEI D.43 0.82 -1.04 0.07 2 84 3.83 4.93 3.85 6.16 11.90 5.17 6 37 4.98 3.6 2.04 3.08 1.81 1.00 -0.42 1.59 3.85 1.82 1.1 1.56 1.52 0.97 2 4 10 7.60 4.56Return On Equity (%) Return On Equity scores are based on a 20% (20-point) weighting. A bolded number indicates achievement of the investor expected ROE shown below each yearly column head. A highlighted number indicates best in-industry performance. Game-To-Date ROE scores are based on a weighted average of the annual ROE performances. Y11 Y12 Y13 Y14 Y15 Y16 Y17 Y18 Y19 Y20 W.LAVO Y135COD (21.0) (22.0) (23.0) (24.0) (25.0) (28.0) (27 0) (28 0) (29.0) (30 0) (22.0) LE BHI IE BIT 4.0 7.2 -9.3 0.6 25.0 27.9 29.1 27.8 11 45.5 50.5 49.0 39.8 35 5 22.4 31.1 19 13 29.1 13.5 17.5 19.3 15 18 14.2 8.1 -3.5 8.1 17 B 2 14.1 28.7 11.2 17.2 10 4 16 7 H 13.8 11.8 6.9 10 6 10 32 8 44.7 21.6 323 19 24 13 24 3 21.7 26.7 11 21 10Stock Price ($ per share) Stock Price scores are based on a 20% (20-point) weighting. A bolded number Indicates achievement of the investor expected stock price shown below each yearly column head. A highlighted number Indicates best in- industry performance. Game-To Date scores are based solely on the most recent year's stock price. Y11 Y12 Y13 Y14 Y15 Y18 Y17 Y18 Y19 Y20 (40.00) (50 00) (85.90) (80.00) (100.00) (125.00) (150.00) (180.00) (215.00) (250 00) 11.86 5.64 5.21 2 40 50 75.19 88.84 24 174.74 289.90 144-17 171.07 86 04 75.00 31.54 28.61 12.58 5.76 5.21 12.05 60.44 24.61 11.82 7.90 5.71 2 105.09 215.84 96.79 24 24 30 76SCORING MEASURES (concluded) Credit Rating Credit Rating scores are based on a 20% (20-point) weighting. A bolded credit rating indicates achievement of the investor expected credit rating shown below each yearly column head. Game-To-Date credit rating scores are based solely on the most recent year's credit rating performance. Y11 Y12 Y13 Y14 Y15 Y16 Y17 Y18 Y19 Y20 (B+ Y13 Scom (B+) (B+) (A-) (A-) (A-) (A) (A) (A) (A) LE BII IE. BII C C- A C+ A 12 11 12 12 11 ppoppypop 12 11 F 4 12 12 11Image Rating Image Rating scores are based on a 20% (20-point) weighting. A bolded number Indicates achievement of the investor expected image rating shown below each yearly column head. A highlighted number indicates best in- industry performance. Game-To-Date scores are based on an average of the most recent three years. Y11 Y12 Y13 Y14 Y15 Y18 Y17 Y18 Y19 Y11 Y13 Y13 Score (70 (72) (72) (75) (75) (77) (77) (80) (80) ((80) Average LE BII IE BIT 48 63 49 14 10 15 12 76 96 18 19 67 85 97 19 88 87 100 24 20 67 63 70 87 19 14 19 15 71 49 50 57 14 10 16 12 68 73 77 73 21 15 20 16 H 62 43 40 48 11 14 10 98 89 91 22 23 20 62 78 81 21 18Corporate Social Responsibility and Citizenship Corporate Responsibility Award Industry 2 Cash Outlays for Corporate Image Rating Points for Exemplary Corporate Citizenship Social Responsibility and Citizenship Generated from Total Dollars (;ooo!] Per Unit Sold (Flunk) CSRC Expenditures Beginning In Year 14 The World Council for Exemplary Corporate Citizenship prosends a distinguished award High Average Low High Averag Low High Average Low to the company making the highest cash oulaye as a Year 11 21,256 5 775 205 0.62 0.00 percentage of revenues for corporate social respons albaty and cut Year 12 19,097 11,181 1,736 3.39 1.46 0.23 10 Your 13 20,739 8,247 1,300 1.70 0.74 0.14 14 Award Winner 2nd Place Your 14 Y14 Y15 Y16 Y17 Y18 Y18BULL'S EYE AWARD One bonus point added to any company's game to-date score when actual performance on Total Revenues AND Earnings Per Share vary by no more for Accurately Forecasting Total Revenues, than 5% from projected performance AND when Image Rating varies by no Earnings Per Share, and Image Rating more than 4 points from the projected Image rating. Revenues (with : 5%) EPS (within 2 ox or * 10/) Image Rating (with# 4 pohl) Cum Your 13 13 Percent Your 13 Percent Your 13 Point Forecas anance Forecast Variance Forecast Vanlance 390 535 328,929 -15.8 % 0.21 -1.04 -598.7 % 53 No 1,112,967 1,008,636 9.0 % 8.80 1 93 -27.5% 100 92 1,317 713 1 299,062 -1.4% 12.25 11.90 -2.8% 98 97 1,025,530 1,016 557 -0.9%% 5.14 4-98 3.0 %% 99 100 586 531 637,931 +8.8 % 2 27 3.08 +95.6 % 87 70 WHOMDOWD 398 564 293 829 -26.3% 1.27 -0.42 -133.2% 56 50 955 590 777.171 -18.7 % 4.57 1.82 -60.2% 90 77 ONOOOO 211,150 193,921 8.2% 1.25 0.97 -22.5% 43 40 900.139 892 699 -0.8 % 4.62 4.56 -1.2% 91 L 922.580 860,311 +4.1 % 4.61 5.40 +17.2% 81 81 Trends In Variances Between Projected and Actual Performance (company and Industry wirkances between projected and actual revenues, EPS, and Image rutino Your 11 Year 12 Year 13 Year 14 Your 15 Your 16 Your 17 Your 18 Your 19 Your 20 Industry 2 - Largest +12.3% +4.0% +16.3% Variance Average 8.3x -18.3% -90.3% smallest 34.1% 44.4% -213.1 % Company C Variance +4.5% +4.0% -1.7%LEAP FROG AWARD Beginning in Your 12, one bonus point is added to the game-to-date overall score of the company whose current-year overall score is most improved for Most Improved Overall Score over the prior year. I all companies fall to Improve their scores from one (current year to current year) your to the next, then no Leap Frog bonus is awar Current-Year Scores and Not Changes Cumu- YM Y12 Y13 Y14 Y15 Y17 Y18 Y19 Y20 A Soon A Score A Score A A A A Scon A A Score 31 16 108 98 114 118 114 89 37 65 118 105 A= net change In score between years Highlighted figure = Leap Frog Award winnerINDUSTRY OVERVIEW Materials Prices Standard Superior Prices of Materials @ perpet) $6.00 $12.00 Low Industry wide superior materials usage (36.2%) load to superior materials prices 10.48 0.23 that wore 1.8% below the base and standard imaterials prices that wore 7 0% above on 0.00 0.00 the base. Industry wide ud ization of production capability (105:8%) had no impact on materials prices. orlala Prices In Your 13 (f parpal) $6.48 $11.77 Footwear Production and Sales North Europe Latin Average America Amen America or Total Notes Superlor Materials Usage 44%% 37% 36% 26% 36% + % usage down 3.2 points from Your 12. Udiization of Production Capability 103.7% 108.0% 102.2% 116.9% 105.8% % usage down 8.8 points from Your 12. Branded - Pairs Avallable (ooma) 41,019 35,215 31,004 28,909 136,147 48.3% higher than Year 13 demand. Demand Forecast 28.204 24,308 19,860 19,960 92 332 From page 4 of FIR for Year 12. Actual 27,900 23.920 19,470 19 920 91,210 al branded demand was 1 2 % lower tan forecast branded comand Que to Pairs Sold (newmet + wholead) 27,898 23.920 19,471 19.920 91,209 decreased compedave witentity. Stockouts-No. of Companies Extent to which orders for branded poire Uniled Orders poop went united due to Inventory shortages & one or more companies. avate -Demand Forecast (0o0s of pain ) 2,730 2,730 2,880 2.880 11,220 From page 4 of FIR for Your 12. Pali's Offered joon.) 4 272 3,376 3,910 4,153 15 711 Private label paks offered wes licher then Pairs Sold gooda) 2.730 2.730 2,787 2.849 11,096 actual private label demand by 28. Demand Forecast North Europe Asla Latin Global America Amca Pacino America Total Notos randed Den Your 14 29,571 25 376 21.333 22 036 98,316 Global demand for Y11-Y15 la expected to grow Thismot + wholook Year 16 31,340 28 904 23 469 24 243 105,962 by 7%-9% annually Glowing to Garth Your 16 32,502 27.979 26 343 26,178 112 102 Yid-Y20. The projected growth rates are not the same for ell regions, as shown In the table Private-Label Demand 3,030 3,030 3,250 3,250 12 560 on pages of the Players Guide. Actual demand 3,360 3.380 3,070 3,670 14,080 growin may vary from the forecast due to Your 16 3,660 3.660 4,070 4.070 15,460 swonger or weaker competitive efforts on the part of rivel companies. Supply / Demand Analysis Potendal Footwear Suppy In Your 14 acted Footwear Demand in Your 14 And yok Beginning Your 14 Inventory 44 938 Branded Demand Forecast 38,316 Potential clobel supply (at max OT) In the upcoming Potential Y14 Production (whoT) 153,600 Private Label Demand Forecast 12,560 year to 79:1% greater dian projected globed deman such excess production capability" Potential Global Supply 198.538 Expected Global Demand 110,878 FIERCE compotion for the next several yours Companies with With undarub ized production capability are advised to sell unneeded production equipment Facility Space Production Equipment Year 13 Facility Space construction of New Space Total Year 13 Production Equipment Space EA AP N.A. EA NA. EA In Y14 6,000 6,000 11,000 3 250 4,000 7,250 6,000 3,000 71000 3 000 18 000 5,000 3,000 6,000 3,000 17,000 5.000 0 11,000 9 000 Goo00 4,000 2000 C 11,000 9:000 20,000 5,000 0 6,000 8,000 19 000 5,000 0 6.000 5,000 16,000 5,000 6,000 4,000 5,000 6,000 600 10,500 5,000 6,000 2 000 2,000 15,000 3,000 2,000 5,000 5,000 8,000 4,000 1,000 5,000 6,000 2,000 13,000 5,000 8,000 1,000 12,000 4,500 4,750 9,250 5,000 9,000 7,000 0068 5,000 6,000 3,750 14,750 5,000 2,000 7,000 7,000 4,750 2,000 6,000 2,500 15,250 51.000 5.000 70,000 45:000 3.000 4 000 178,000 40.500 5,000 56 750 25.750 128 000Income Statement Data ($000s) Net Sales Revenues Cost of Wathouse Admin operaing Intorod Income Not Internet Total P iis Sold E pens Proft Faxes Prom 81,773 247 156 O 328 929 161 945 36 329 109,910 16,214 4,531 25 384 -20 858 223,792 687 431 532 1,006 636 468 643 76,943 251 139 30,962 178 949 43,385 39 856 92 997' 290,844 932 270 75 998 1 290 052 429.5 91,010 389,622 35 285 353 576 36 789 95 036 1,751 175,992 611,980 74 209 1,016 557 554 436 89,131 184 067 24,864 164,059 25,940 41,436 96,683 189,299 8 765 0 637,931 310,828 63,717 137,761 20,034 105 561 17 516 26 414 61,631 81483 206 664 6 782 293 829 146,765 31,146 100 879 14,644 396 8 798 0 8 402 188,480 458,804 15.382 777,171 433,713 69 875 179,127 21,865 72,591 21,662 15 279 35 650 50 751 143 170 0 193,921 88,183 25 491 22 921 19.264 38,062 9.202 8 312 19 394 197,524 576,277 67,800 802,699 454,172 68 204 193,613 25 864 150,846 26 208 97,391 87,247 195,462 580 327 79.491 960,311 465 984 82 423 197,946 29.214 194,744 31,180 48 678 113,350 167.540 485.074 37 623 740.704 350 423 63 427 176,690 23.824 128.332 24 606 31.230 69 945Selected Balance Sheet Data ($ODDs) Assets Liabilities Shareholder Equity Cash Current Fixed Total Current Long Term Total Beginning Earnings Ending On Hand Assets Assets Assets Liabilitie Loans Liabilities Equity Purcha Retained Equaly O 322,452 264,225 586,677 322,939 49,500 372,439 235,091 -20,853 214,238 307,715 577,810 885,525 114 675 424,500 539,175 291,943 -38 590 92,997 346,350 23,316 370,832 857,746 1,228,578 213,024 575,000 788 024 437 474 -218 671 221,751 440 554 3,627 312,312 464,560 776,872 93,615 219,500 313,115 399 224 -30,207 94,740 483 757 45,042 302,672 327,152 629,824 80 606 165,500 246,106 322,087 61 631 383,718 126,815 278,775 405 590 117,306 49 500 166 806 247,186 -8,402 238 784 0 296,498 389,170 685,668 100,161 255,900 356,061 306 169 -12 212 35 650 329 607 237,204 305 042 542 246 152,838 98,300 251,138 271,714 19.394 291 108 128,552 324,827 489 504 814,331 81,085 309,000 380 085 382 472 -43,558 85 332 424 68,938 304,666 510,864 815,530 94,824 247,500 342,324 375,606 97 600 473,206 26 948 290.599 446 485 737.084 137.107 239 420 376.527 326.897 $4.324 87 984 380 557Selected Financial Statistics Profitability Measures Dividend Data Credit Rating Measures Shares Gross Operating Net Div. Per Total Div. Interest Debt to Default Risk of Stock Profit Profit Profit Payout Share Payment (percent of Coverage Assets Risk of Current Days of Outstanding Margin Margin Margin (W/share) ($0008) net profit) Ratio Ratio Ratio Default Ratio riventory 50.8% 1.4% -6.3% 0.00 0.0% 0.18 0.63 D.OO N/A 1.00 609 day 20,000 53.4% 17.8% 9.2% 0.00 0.0% 4.12 D.61 2.07 Medium 2.68 127 days 18,854 66.9% 27.2% 17.1% 0.00 0.0% 9.61 0.64 1.89 High 1.74 94 days 18,628 45.5% 16.1% 9.5% 0.10 1,943 2.0% 6.32 0.40 1.52 High 3.34 157 day 19.425 51.3% 16.5% 9.7% 0.00 0.0% 6.03 0.39 1.01 High 3.75 210 days 20,000 50.1% 0.1% 2.9% 0.00 0.0% 0.05 0.41 0.20 High 1.08 193 days 20,000 44.2% 9.3% 4.6% 0.00 0.0% 3.35 0.52 1.73 High 2.96 216 day 19.600 54.5% 19.6% 10.0% 0.00 0.0% 4.14 0.46 1.06 High 1.55 791 days 20,000 49.1% 16.9% 9.8% 0.10 1,915 2.2% 5.76 D.48 2.27 Medium 4.01 37 days 19 154 52.5% 20.3% 11.8% 0.75 15,750 13.9% 6 25 0.42 2.10 Medium 3.21 94 day 21,000 52.7% 17.1% 9 4% 0.10 1.961 1.8%% 4.58 0.50 1.39 2.53 253 days 19 666PERFO MANCE BE HMARKS Production Benchmarks Industry 2 North America Low Average High Percentage of New Production Equipment 85% 97 100% 0% Labor Total Regular Compensation ($ / worker / year) 35,030 39,970 45,575 Statetics Workforce Productivity (pairs / worker / your) 4,635 4,875 5.042 0 Production Labor Cost ($ per pair after rejects) 7.70 8.38 9.04 0.00 Supervisory Compensation ($/ supervisor/ year) 61,208 63,562 76,888 0 Branded Superior Materials Usage 30% 4.2 76% Production TQM/6-Sigma Spending - Current ($/pair produced) D.00 2.71 5.00 0.00 Cumulative (SODES) 3.993 37,020 87 925 Total Production Cost ($ per pair produced) 24.82 29.14 33.10 0.00 Reject Rate 1.5% 7.79 12.3% 0.0% Cost Per S/Q Star (total production cost per pair + 3xQ rating) 3.10 5.29 8.86 0.00 Industry 2 Europe-Africa company Low Average High Percentage of New Production Equipment 100% Labor Total Regular Compensation ($/ worker/ year) 27,258 Stabatics Workforce Productivity (para / worker / year) 4,057 0 Production Labor Cost ($ per pair aner rejects) 6.91 Supervisory Compensation ($ / supervisor/ your) 36,908 0 Branded Superior Materials Usage 40%% 0% Production TOM/6-Sigma Spending - Current (S/pair produced) 2.20 0.00 Cumulative ($0Obs) 13,199 0 Total Production Cost ($ per pair produced) 28.64 0.00 Reject Rate 8.8%% 0.0% Cost Per S/Q Star (total production cost par pair + 8/Q raling) 5.47 0.00 Industry 2 Asia Pacific Company Low Average High Percentage of New Production Equipment 34% 54% 64% Labor Total Regular Compensation ($ / worker / year) 12 363 14,867 21,162 12,363 Statistics Workforce Productivity (pairs / worker / year) 3,369 3.621 3.860 3,711 Production Labor Cost ($ per pair after rejects) 3.61 1.24 5.48 3.61 Supervisory Compensation ($/ supervisor / your) 25,503 25,809 26 530 25,758 Branded Superior Materials Usage 39% 74% 0% Production TOM/6-Sigma Spending - Current ($/peir producerl) 0.00 2.23 5.00 0.00 Cumulative ($000s) 39 237 105,095 Total Production Cost ($ per pair produced) 16.92 24.48 30.22 16.92 Reject Rate 1.5% 6.8% 13.8% 7.4% Cost Per 8/Q Star (hotel production cost per pair + $/Q rating) 2.65 5.40 8.46 8.46 Industry 2 Latin America Company Low Average High C Percentage of New Production Equipment 100% 100% 100% Labor - Total Regular Compensation ($ / worker / year) 12,241 15,007 21,242 12,363 Statistics Workforce Productivity (pairs / worker / year) 3,738 3,979 4,179 3,955 Production Labor Cost ($ per pair mier rejects) 3.29 3.95 5.19 3.39 Supervisory Compensation ($/ superdeor / year) 25,503 25,758 26,270 25,758 Branded Superior Materials Usage 0% 39% 74% OX Production TOM/6-Sigma Spending - Current ($/pair produced) 0.00 2.79 5.00 0.00 Cumulative (SoDes) 14.541 54 000 Total Production Cost ($ per pair produced) 18.29 26.36 38.34 18.29 Reject Rate 1.5% 7.2% 14.9% 14.9% Cost Per S/Q Star (total production cost per pair + SAQ rating) 2.66 4.99 8.71 B.71 Note: To protect individual companies from having competitively sensitive data revealed to rival companies, only the industry averages ers reported for regions with 2 or 3 production facilities. Industry low and high numbers are reported only for regions with 4 or more production facilities. No benchmark date is reported for regions with only 1 production factity.PERFO MANCE BE HMARKS (oond udoc) Branded Operating Benchmarks Industry 2 North America company Low Average C Distribution and Ware use Costs (purp kewl thebored ) 3.41 5.47 9.85 9.85 Cost of Branded Palra Sold (production, freight, >emails cost a] antman) 23.72 29.38 34.10 23.72 Internet Segment Marketing Expenses (parpaired!) 14.80 23.08 37.73 22.72 Operating Profit ( perpetraold) 11.01 29.87 44 83 42 10 Operating Profit Margin 11.4% 29.9% 42.7% 40.7% Wholesale Segment Marketing Expenses (#parpetr mokg) 4.79 17.48 21.94 21.69 Operating Profit ( pur pakrooked) -1.17 7.74 15.31 14.03 Operating Profit Margin -2.0% 12 2% 21.6% 21.6% Industry 2 Company Europe-Africa Low Average High C Distribution and Warehouse Costs (#porpekawilbloforat) 8.31 9.63 12.97 11.23 Cost of Branded Pafre :3old (production, freight, strain cant w/7 among) 25.09 33.27 39.33 25.09 Internet Segment ting Expenses ( parpair cold) 15.22 22 02 30 08 22.40 Operating Profit ( perpetrady) 13.65 30.16 47.66 40.32 Operating Profit M 13.9% 29.1% 41.9% 39.2% Wholesale Segment Marketing Expenses ( parpetr wok) 6.05 17.34 22.58 21.87 Operating Profit ( par pair soko) 4.56 5.89 15.80 11-96 Operating Profit Margin -7.7% 8.9% 21 8% 18.5% Industry 2 Company Low Average High C Distribution and Warehouse Costs (&purpair aw ibble forsets) 3.35 5.11 8.32 198 Cost of Branded Pairs Gold (production, freight x rela cont atwin 17.99 26.02 31.22 17.99 Internet Segment arksting Exporises ( parpal cok) 19.98 28.13 47-16 27.34 Operating Profit @ perpetrookg) 7.98 29 98 45 07 43-06 Operating Profit Margin 8.1% 29.4 12.26 41.7% Wholesale Segment 5.36 18.75 25.12 25.12 Operating Profit (& par pair coke) -3.49 11.17 16.77 16.10 Operating Profit Margin -5.8% 17.5% 26.3% 24.8% Industry 2 Latin America Company Low Average High Distribution and Warehouse Costs ($ perpet and bla forauto) 4.49 8.23 12.23 4.56 Cost of Branded Pairs Sold production, tight suite cont nowwrong 19.77 30.96 39.82 19.77 Internet Segment Marketing Expenses ( parpatrol) 11.78 24.03 39.52 11.78 Operating Profit (purpurrwong) 1.29 31.49 56-14 58.14 Operating Profit Margin 1.4% 29.9% 54.6% 54.6% Segment Marketing Expenses (perpetr s) 0.95 18.20 22.86 22.86 Operating Profit @ parpair cole) -12.44 9.83 20.78 16.19 Operating Profit Margin 22.4% 14.1% 29.9% 25.1% Private-Label Operating Benchmarks Industry 2 Company Low High C Cost Per Pair Sold (production,Within, xtube) 26.42 32 84 26.42 North America Margin Over Direct Cost @ par petrado) +0.16 +3.48 +5.69 +4108 Europe- Africa Cost Per Pair Sold goodson, With,water) 28.62 30.68 36.43 28.41 Argin Over Direct Coot @ per patrado) +9.23 +6.95 24.92 31.16 21.25 Asia Pacific Cost Per Pair Sold Gproduction, WILL Win when 21.25 argin Over Direct Cost ( per pair soly) -235 4527 +10.23 +8.40 21.57 25.25 34.97 21.57 Latin America Cost Per Pair Gold production, tight, With sulen) Margin Over Direct Cost (pipesvila) -1.22 +8.09 +13.82 +13.77 2018 COLO BUS SOCELEBRITY ENDO SEMENTS A D INDUSTRY TRENDS Celebrity Endorsements Most Recent Contract Offers Year 14 Consumer Appeal Matter In parens Indicates company that made offor) (sum of consumer appeal indexes for No. of bach company In the upcoming year? Year 14 Highest 2nd ard contract Holder Offers Offer Highest Highest Co. N.A. AP LA celebrity 10,000 (G) 7,323 (9) 0 0 Judy Judge C Company 6,500 (B) Kimmie Jimmel G Company 10,000 (G) 7,500 ( 7,323 ( 10,000 (G) 7,323 6 850 C C 385 375 430 410 Bud Birkenstock G Company 10,000 (G) 7,323 ( 6,500 (B) 175 160 180 145 Jose Montana G Company Samuelle Jackson C Company (1) 3,832 (C) 3,000 (B) 90 80 100 65 C Company 4,000 (1) 3,832 3,000 (B) Bronko Mars Steff Caraway D Company 7 5,000 (D) 4,000 (1) 3,832 ( 230 195 225 UNIOTMO 220 2,449 0 Jay XYZ Insoulz 6 3,832 (C) 8 (E) 5,556 (C) 6,500 75 70 55 90 Nunchuck Norris E Company JayWalker 6 6,000 () 5,556 (C) 5,500 (D 155 185 140 175 Roger Federation C Company 3 (C) 5,000 (1) 4,000 Avg 111 109 110 111 Nick Shavan Anderson Blooper C Company 5,556 (C) 5,000 () 4,000 JayWall 6 6,000 31 5,656 (C 5,500 Mic Jagermeister Jim Hardball C Company 5,556 (C) 5,000 (1 4,000 6,300 (E) 5,556 LaBron Game D Company 7,000 (]) Pricing and S/Q Rating Trends NORTH AMERICA EUROPE AFRICA Internet Price Wholesale Price NO Rating Internet Price Wholesale Price S/Q Rating 5.0k $70 4.84 1 Price $50 $40 11 12 13 14 15 16 17 18 19 20 10 11 12 13 14 15 16 17 18 19 20" 10 Year Year ASIA PACIFIC LATIN AMERICA Wholesale Price - S/Q Rating Intemet Price - Wholesale Price -70 Rating Intamet Price $70 $60 4.34 4.0* $50 $40 12 13 14 15 16 18 19 20" 11 12 13 14 15 16 17 18 19 20 11 Year Year TO GLO BUS Softwe
Step by Step Solution
There are 3 Steps involved in it

Get step-by-step solutions from verified subject matter experts