

Question: Look at the graph below. What conclusions can you draw? Average High and Low Temperatures in Shore Grove 86 89 88 *82 79 72 72
Look at the graph below. What conclusions can you draw? 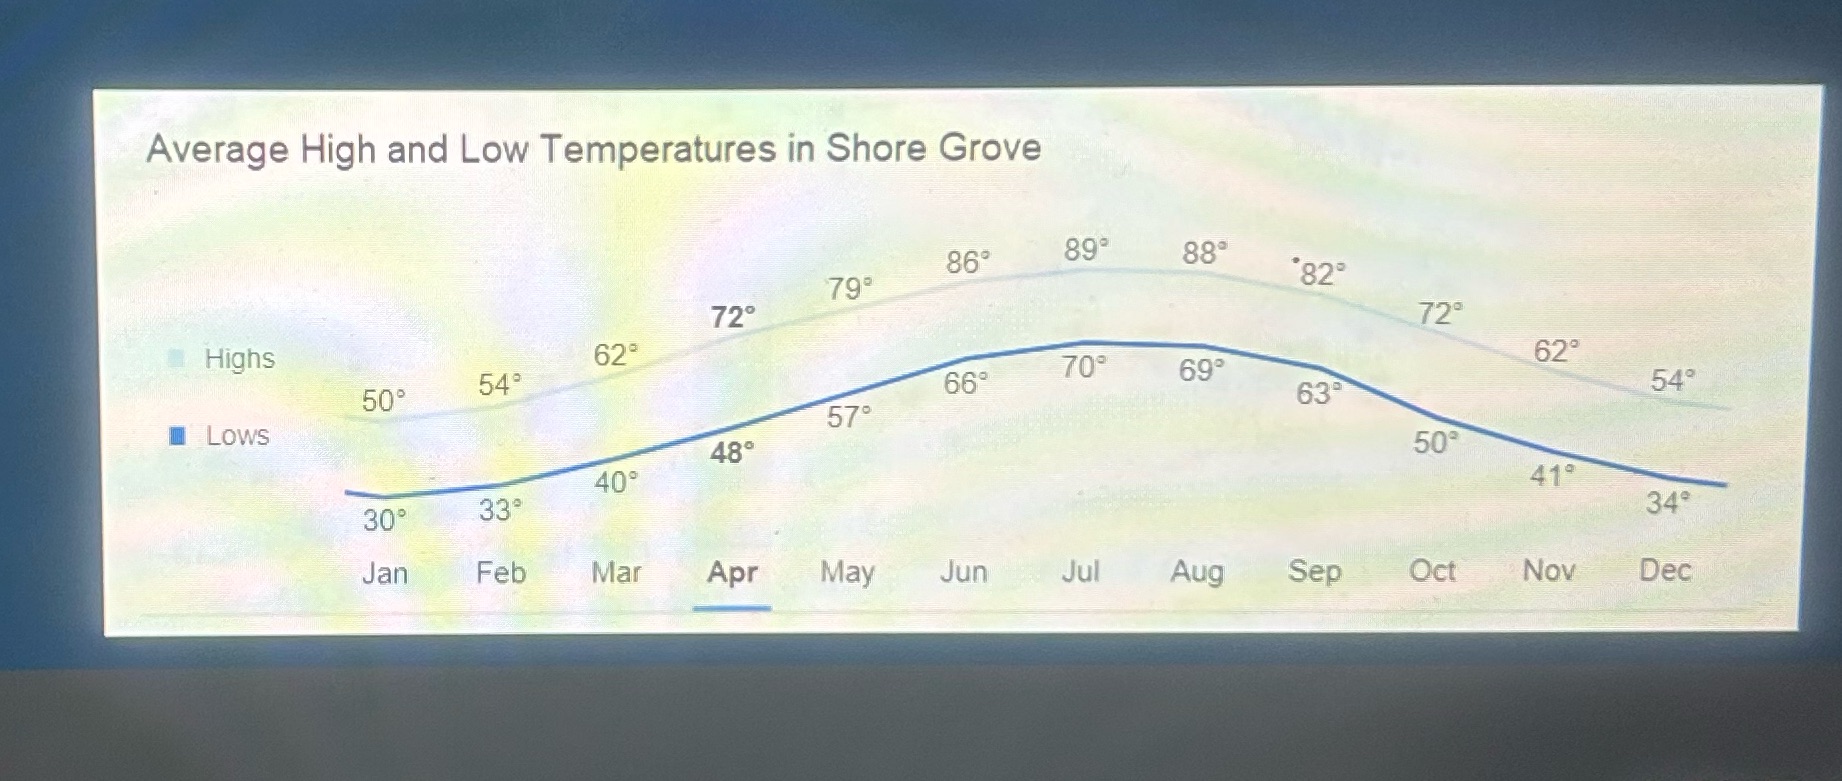
Average High and Low Temperatures in Shore Grove 86 89 88 *82 79 72 72 Highs 62 62 70 69 54 66 54 50 63 57 Lows 48 50 40 41 33 34 30 Jan Feb Mar Apr May Jun Jul Aug Sep Oct Nov Dec
Step by Step Solution
There are 3 Steps involved in it
1 Expert Approved Answer
Step: 1 Unlock

Question Has Been Solved by an Expert!
Get step-by-step solutions from verified subject matter experts
Step: 2 Unlock
Step: 3 Unlock