

Question: Look at the graph in PROBLEM C. For a fixed implied volatility, we see that as we go lower in strike the put price drops
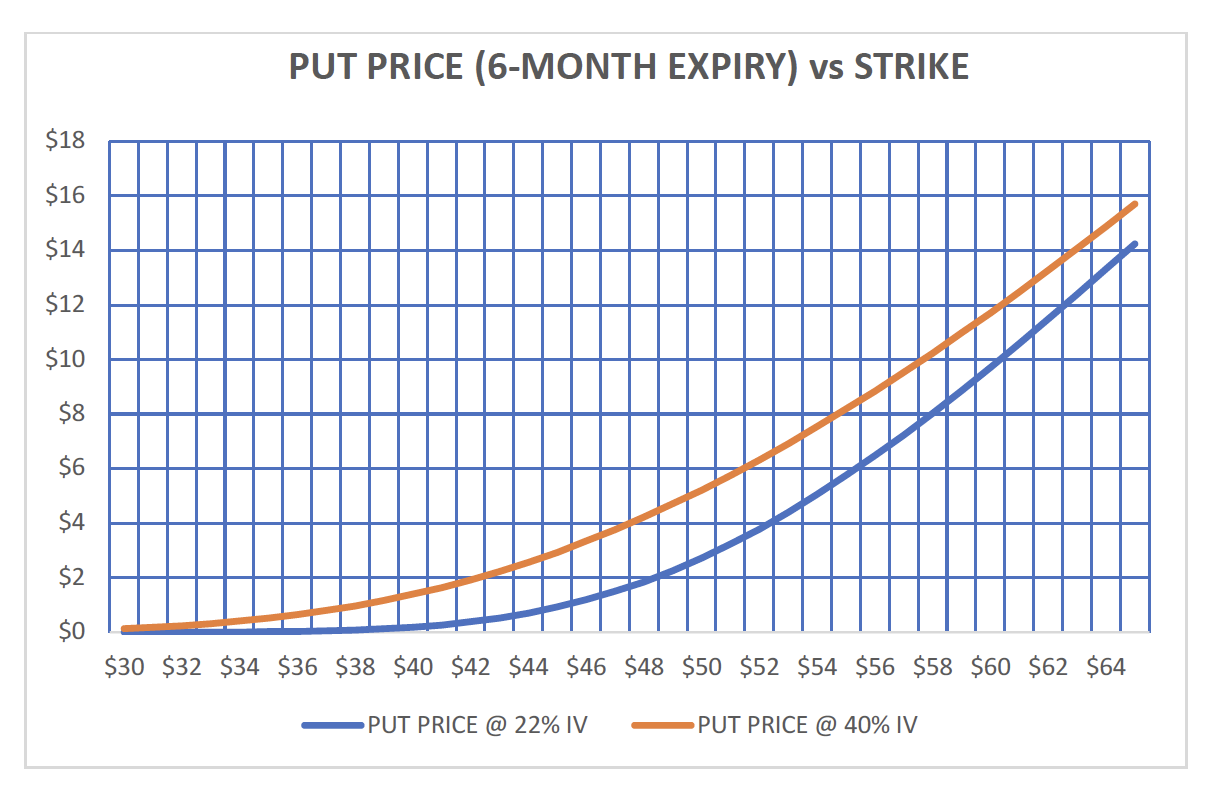
Look at the graph in PROBLEM C. For a fixed implied volatility, we see that as we go lower in strike the put price drops but at a slower and slower rate. Any ideas on why this is happening? Hint: Recall that the put price can be obtained as the prelsent value of the expected option payoff under the adjusted density function for S(T): exp(-r(T-t)) S(K x) pdf(x) dx where the integral is from 0 to K. What does the model assume about the shape of this pdf? PUT PRICE (6-MONTH EXPIRY) VS STRIKE $18 $16 $14 $12 $10 $8 $6 $4 $2 $0 $30 $32 $34 $36 $38 $40 $42 $44 $46 $48 $50 $52 $54 $56 $58 $60 $62 $64 -PUT PRICE @ 22% IV PUT PRICE @ 40% IV
Step by Step Solution
There are 3 Steps involved in it

Get step-by-step solutions from verified subject matter experts